Toronto election 2026 · Results
Toronto Mayor Election Results 2026 by Ward
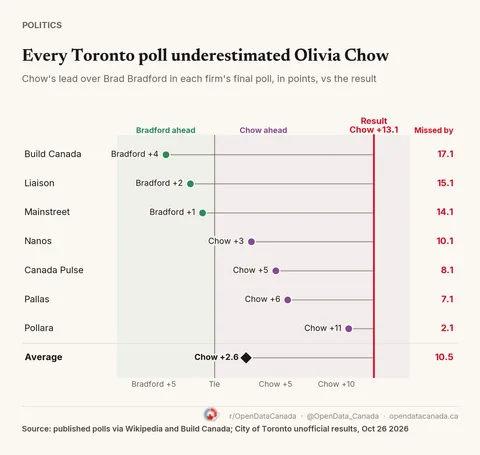
Olivia Chow won a second term. With all 1,431 polls counted she beat Brad Bradford 54.2% to 41.1%, a lead of 13.1 points, far more than the 2.6-point lead the final polls gave her. The map below shows the result in each ward, from the City of Toronto's unofficial count.
Other candidates: 4.7%. 982,660 votes counted. The final polls had Chow ahead by 2.6 points; the count so far has Chow ahead by 13.0.
The count against the final polls · Chow's lead over Bradford, points
Grey dots: each firm's final poll; diamond: their average, labelled Polls (Chow +2.6). Final count. Closest final poll so far: Pollara, 2.0 points off.
Who leads in each ward · number = lead in points
Tap or hover a ward for its numbers.
Other Ontario mayor races
Results for other cities will appear here as they come in.
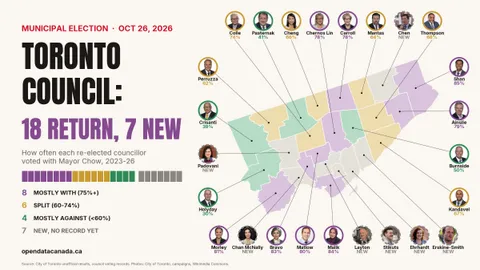
Council results for all 25 wards, and how the new council lines up with Chow, are in Toronto council election results 2026.
Where did Chow gain since 2023?
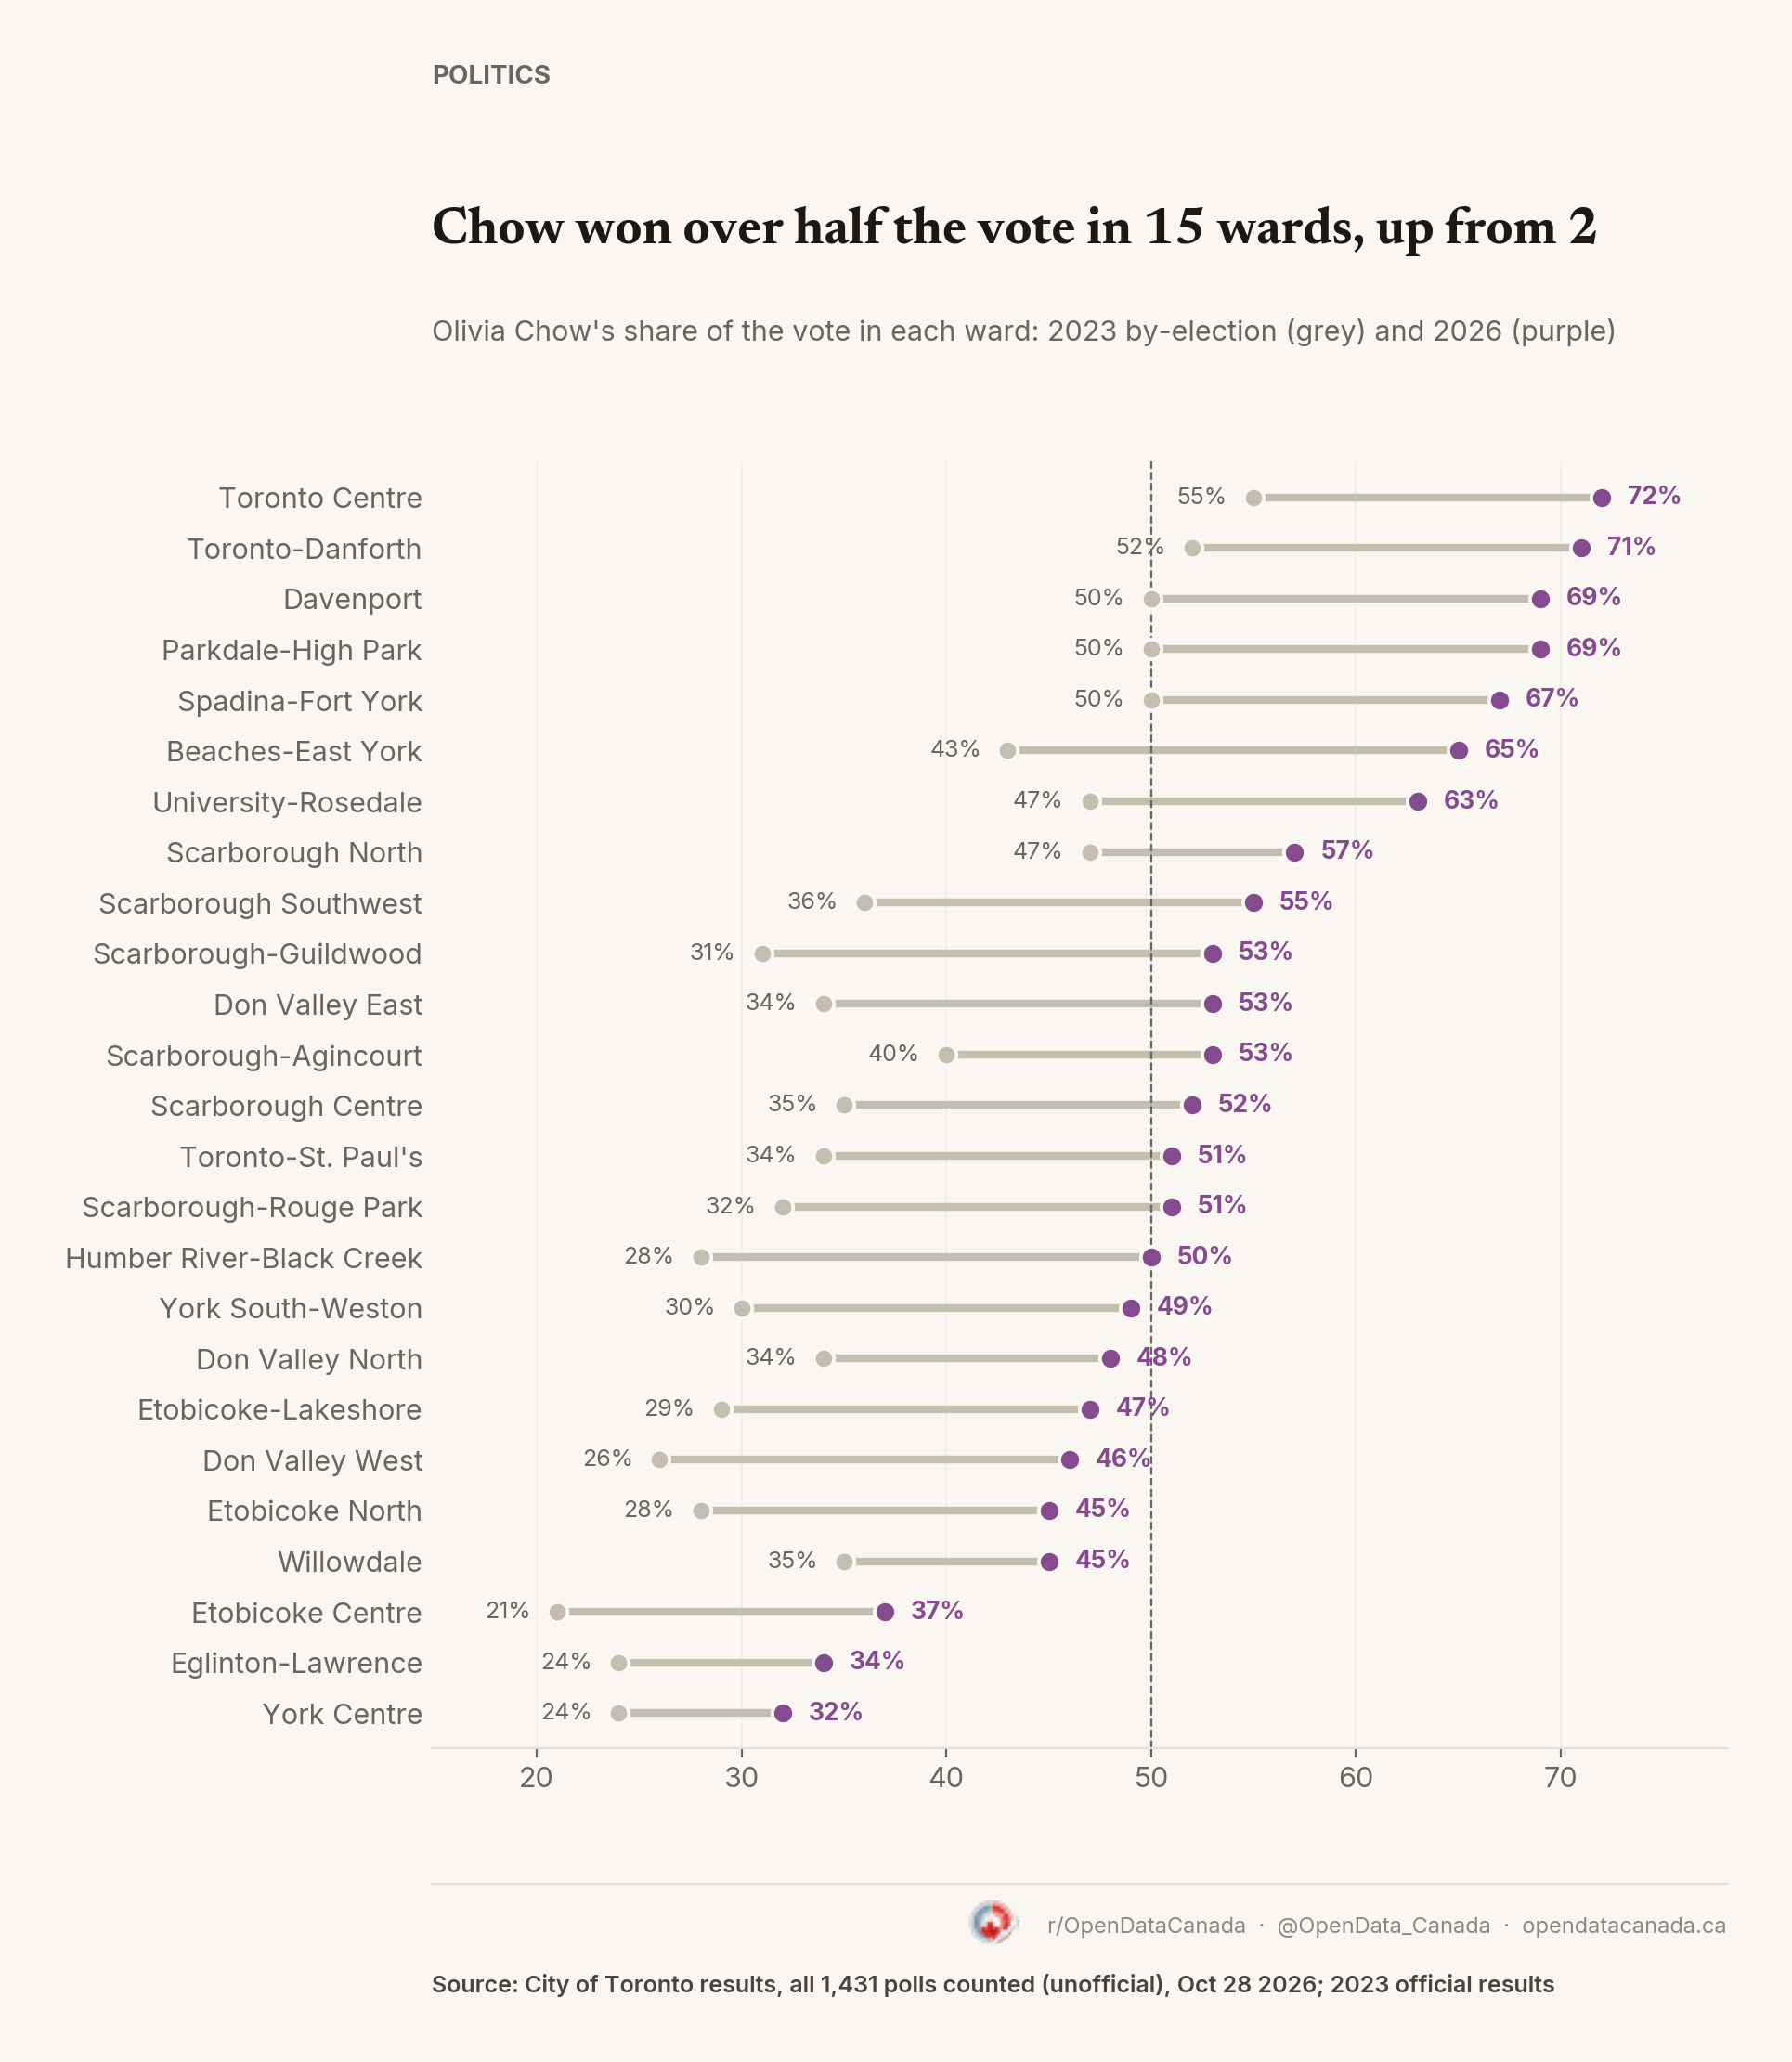
Chow's share of the vote rose in every one of the 25 wards compared with the 2023 by-election, by between 8 and 23 points. Some of that was expected: in 2023 she was one of 102 candidates, and this year the race came down to two.
Her biggest gains were in Scarborough-Guildwood (up 23 points), Beaches-East York (up 22) and Humber River-Black Creek (up 22). Beaches-East York is Bradford's own council ward. Chow took 65 per cent there and Bradford 31.
Her smallest gains were in York Centre (up 8), Scarborough North and Eglinton-Lawrence (both up about 10). Bradford won York Centre and Eglinton-Lawrence with more than 60 per cent of the vote. Scarborough North was already one of Chow's strongest wards in 2023.
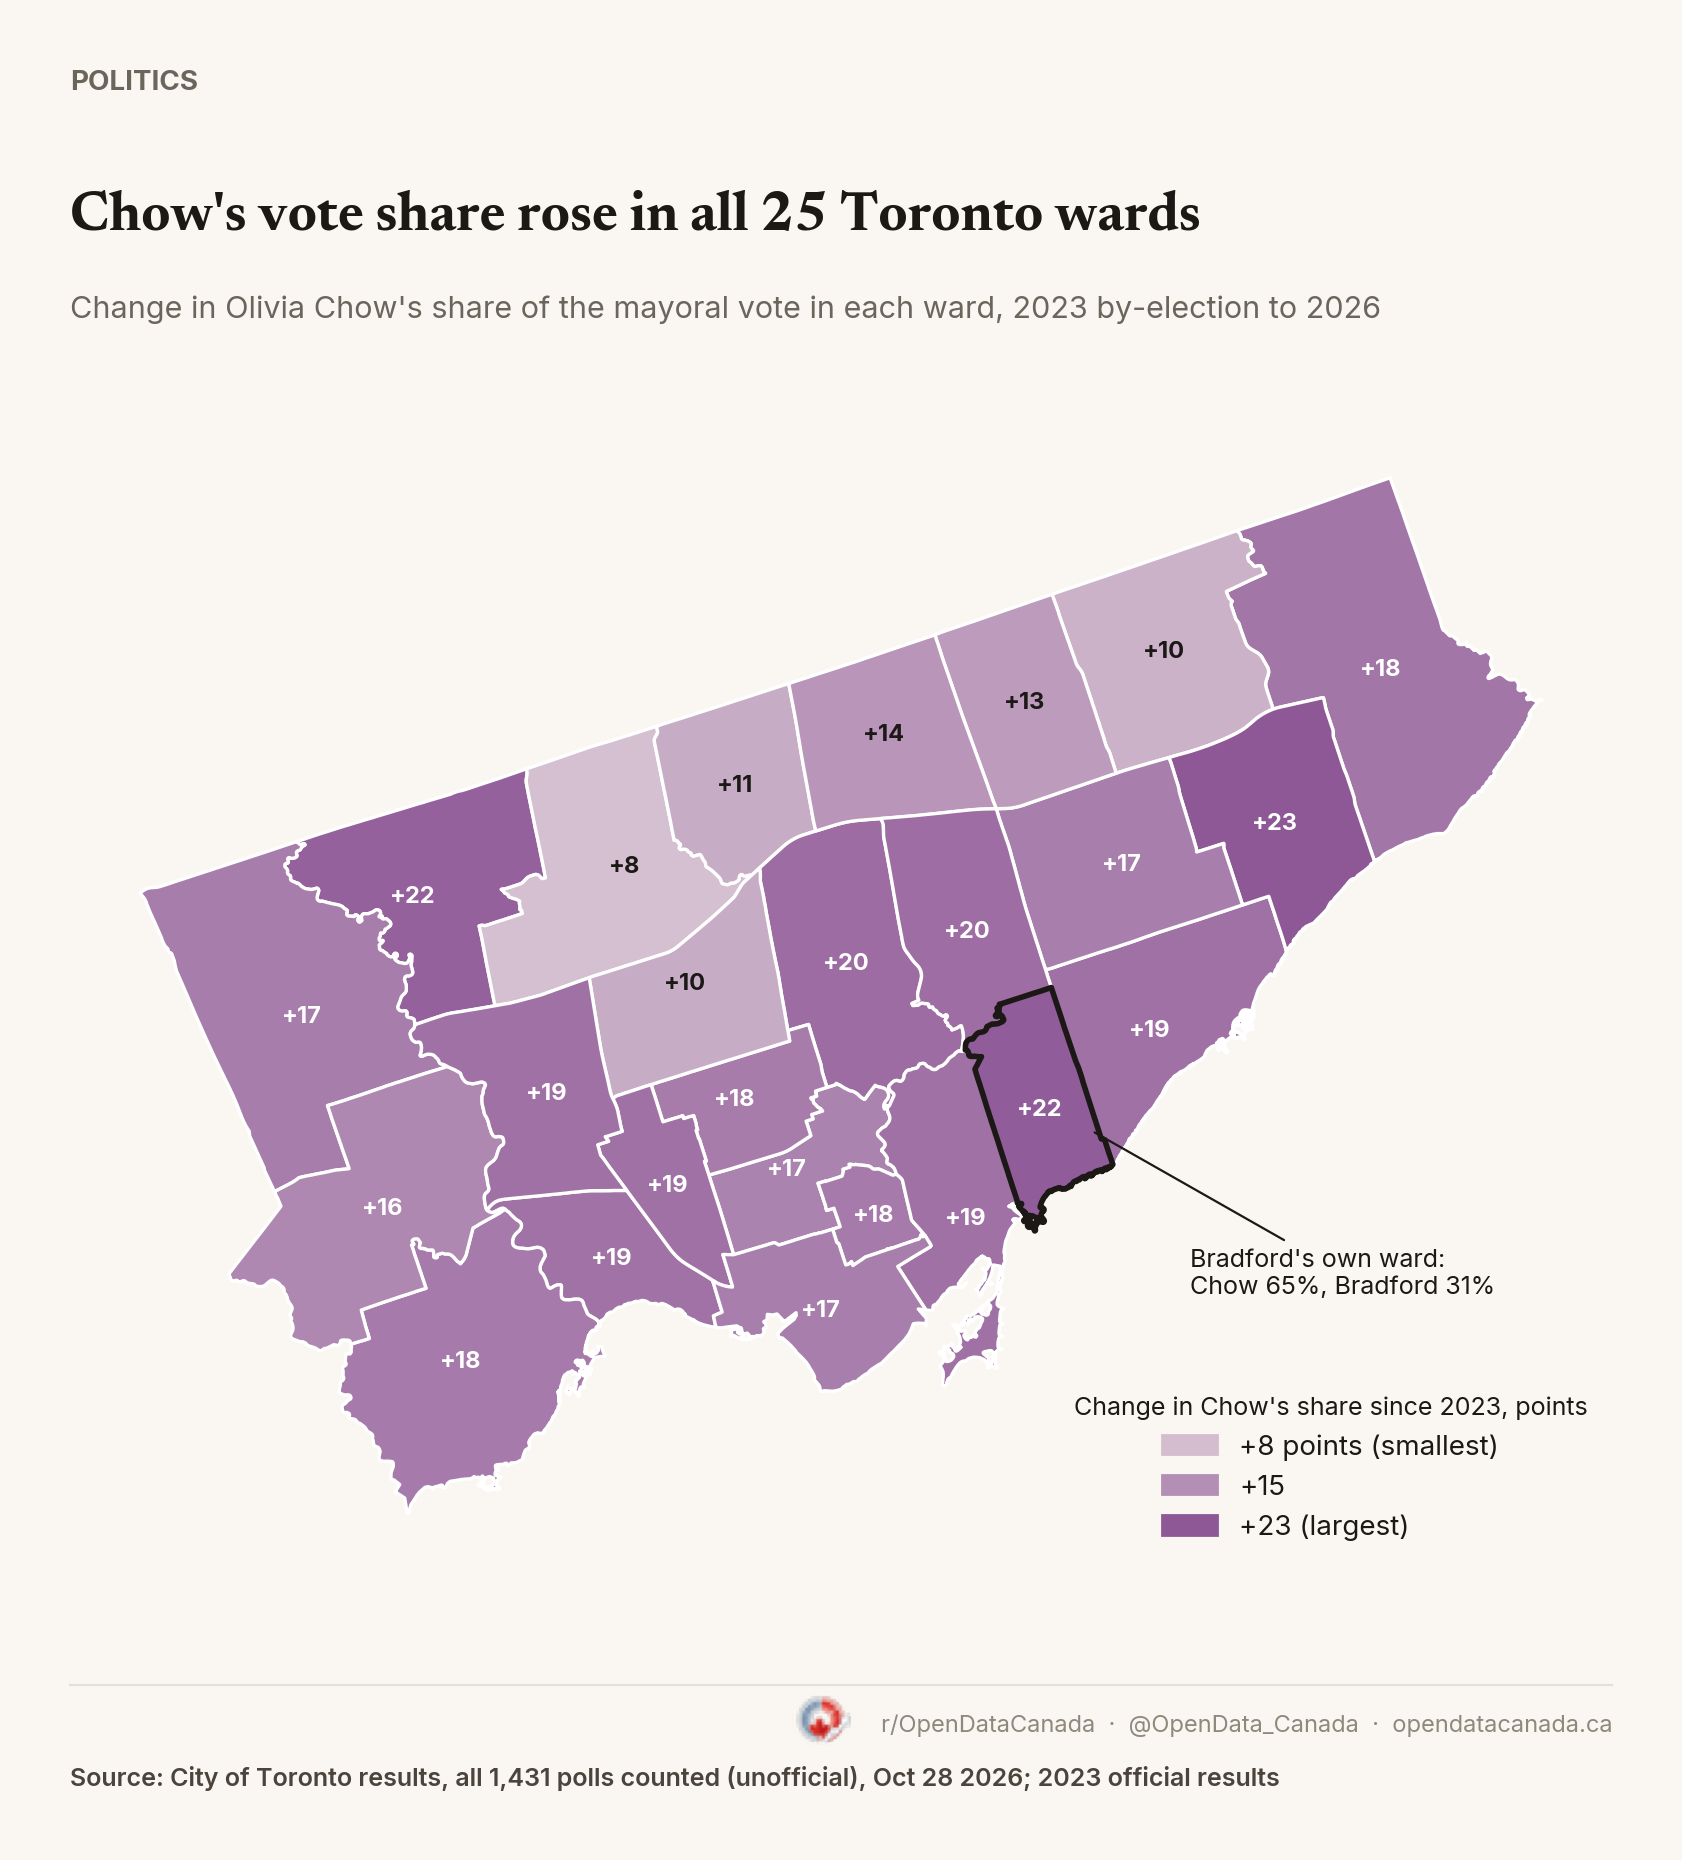
In 2023 Chow won more than half the vote in 2 wards, Toronto Centre and Toronto-Danforth. This year she did it in 15. Bradford led in 6 wards: York Centre, Eglinton-Lawrence, Etobicoke Centre, Willowdale, Don Valley West and Etobicoke-Lakeshore.
The pre-election analysis follows: what the polls said, and how far Toronto's final polls have missed before.
Toronto picks its mayor on Monday, Oct. 26. Polls are open from 10 a.m. to 8 p.m. To find where to vote, use the City's MyVote lookup. It is a two-person race between Mayor Olivia Chow and Brad Bradford, the city councillor for Beaches-East York. Former Conservative MP Chris Alexander was the third name in the polls until he dropped out on Oct. 6. He did not endorse anyone.
A lot of the vote is already in. The City of Toronto says 222,550 people voted during the six advance voting days, Oct. 6 to 11. That is 72 per cent more than the 129,745 who voted early in the 2023 by-election, when about 725,000 people voted in total. Toronto's turnout averaged 35.3 per cent in 2018 and 2022, 11th of 27 big Canadian cities; see the municipal turnout ranking.
Who is winning the Toronto mayoral race?
It depends on the firm. Seven firms have finished a poll since Oct. 12, the last two weeks of the campaign. Four have Chow ahead and three have Bradford ahead. Averaging the latest poll from each gives Chow 49.6 per cent and Bradford 47.0, a lead of 2.6 points.
The spread between firms is wider than the lead. Pollara, published by Global News, has Chow up 11: 55 to 44 (Oct. 16 to 21, 1,094 people). That poll was paid for by CUPE Local 416, a city workers' union that endorsed Chow on Oct. 1. At the other end, Build Canada, a policy group that ran and paid for its own poll, has Bradford up 4: 48 to 44 (Oct. 11 to 16, 991 people). Leave both of those out and Chow's lead is 2.2 points.
Mainstreet Research (Oct. 16 to 18) and Liaison Strategies (Oct. 18 to 19) also have Bradford ahead, by 1 and 2 points. Before the last two weeks, Bradford had not led a single campaign poll.
| Firm | Fieldwork | Chow | Bradford | Lead |
|---|---|---|---|---|
| Pollara (for CUPE Local 416) | Oct. 16 to 21 | 55 | 44 | Chow +11 |
| Pallas Data | Oct. 14 | 52 | 46 | Chow +6 |
| Canada Pulse Insights | Oct. 16 to 21 | 51 | 46 | Chow +5 |
| Nanos Research | Oct. 15 to 18 | 50 | 47 | Chow +3 |
| Mainstreet Research | Oct. 16 to 18 | 48 | 49 | Bradford +1 |
| Liaison Strategies | Oct. 18 to 19 | 47 | 49 | Bradford +2 |
| Build Canada | Oct. 11 to 16 | 44 | 48 | Bradford +4 |
| Average | 49.6 | 47.0 | Chow +2.6 |
Scope Research and Forum Research each released one poll on Oct. 6 (Chow +4 for both) and none since, so they are left out of this average. Firms also count undecided voters differently: some report only decided voters, others add people who lean to a candidate.
Did Bradford gain at Chow's expense?
Chow's support has hardly moved all campaign. In the last poll from each firm before Alexander quit, she averaged 49.3 per cent. In the final two weeks she averages 49.6.
Bradford's support moved instead. He averaged 36.8 per cent before Oct. 6 and 47.0 in the final two weeks, a jump of about 10 points. Alexander was polling at 7.2 per cent on average when he left. Bradford picked up roughly all of it, plus a few points from people who had been undecided.
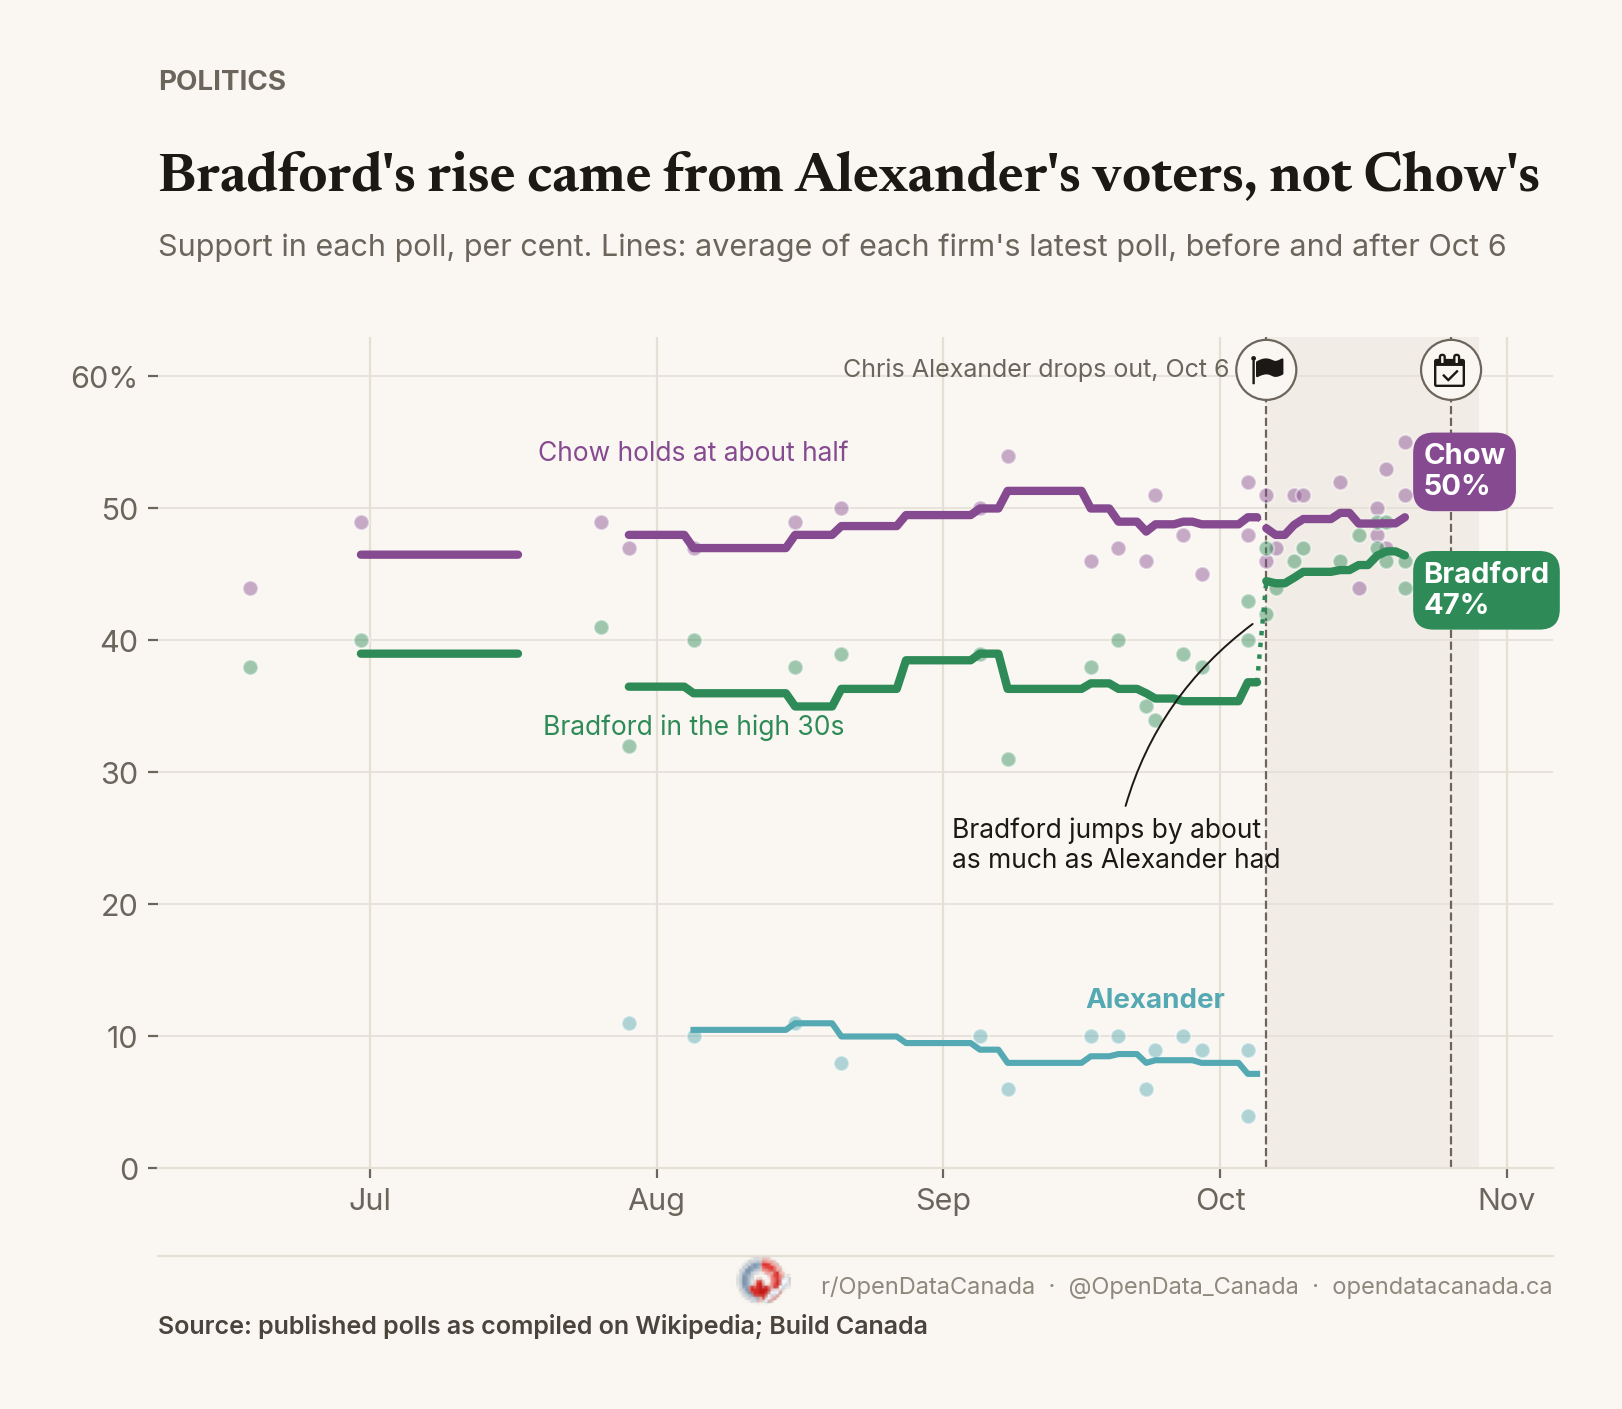
Chow has held about half the decided vote all campaign and has not gone above it. Bradford now has nearly everyone else.
How accurate were Toronto's polls in past elections?
In the city's two most recent close races, the final polls made the leader look safer than they were. This time they went the other way: the 2026 polls missed Chow's margin by 10 points.
In 2014, the last polls from Forum Research, Ipsos and Mainstreet Research had John Tory ahead of Doug Ford by 10.3 points on average. Tory won by 6.6. In the 2023 by-election, the last polls from Mainstreet, Forum and Liaison had Chow ahead of Ana Bailão by 9.7 points on average. Chow won by 4.7.
The winner was right both times, but the margin was too big by 3.8 points in 2014 and 5.0 in 2023. The average miss was 4.4 points.
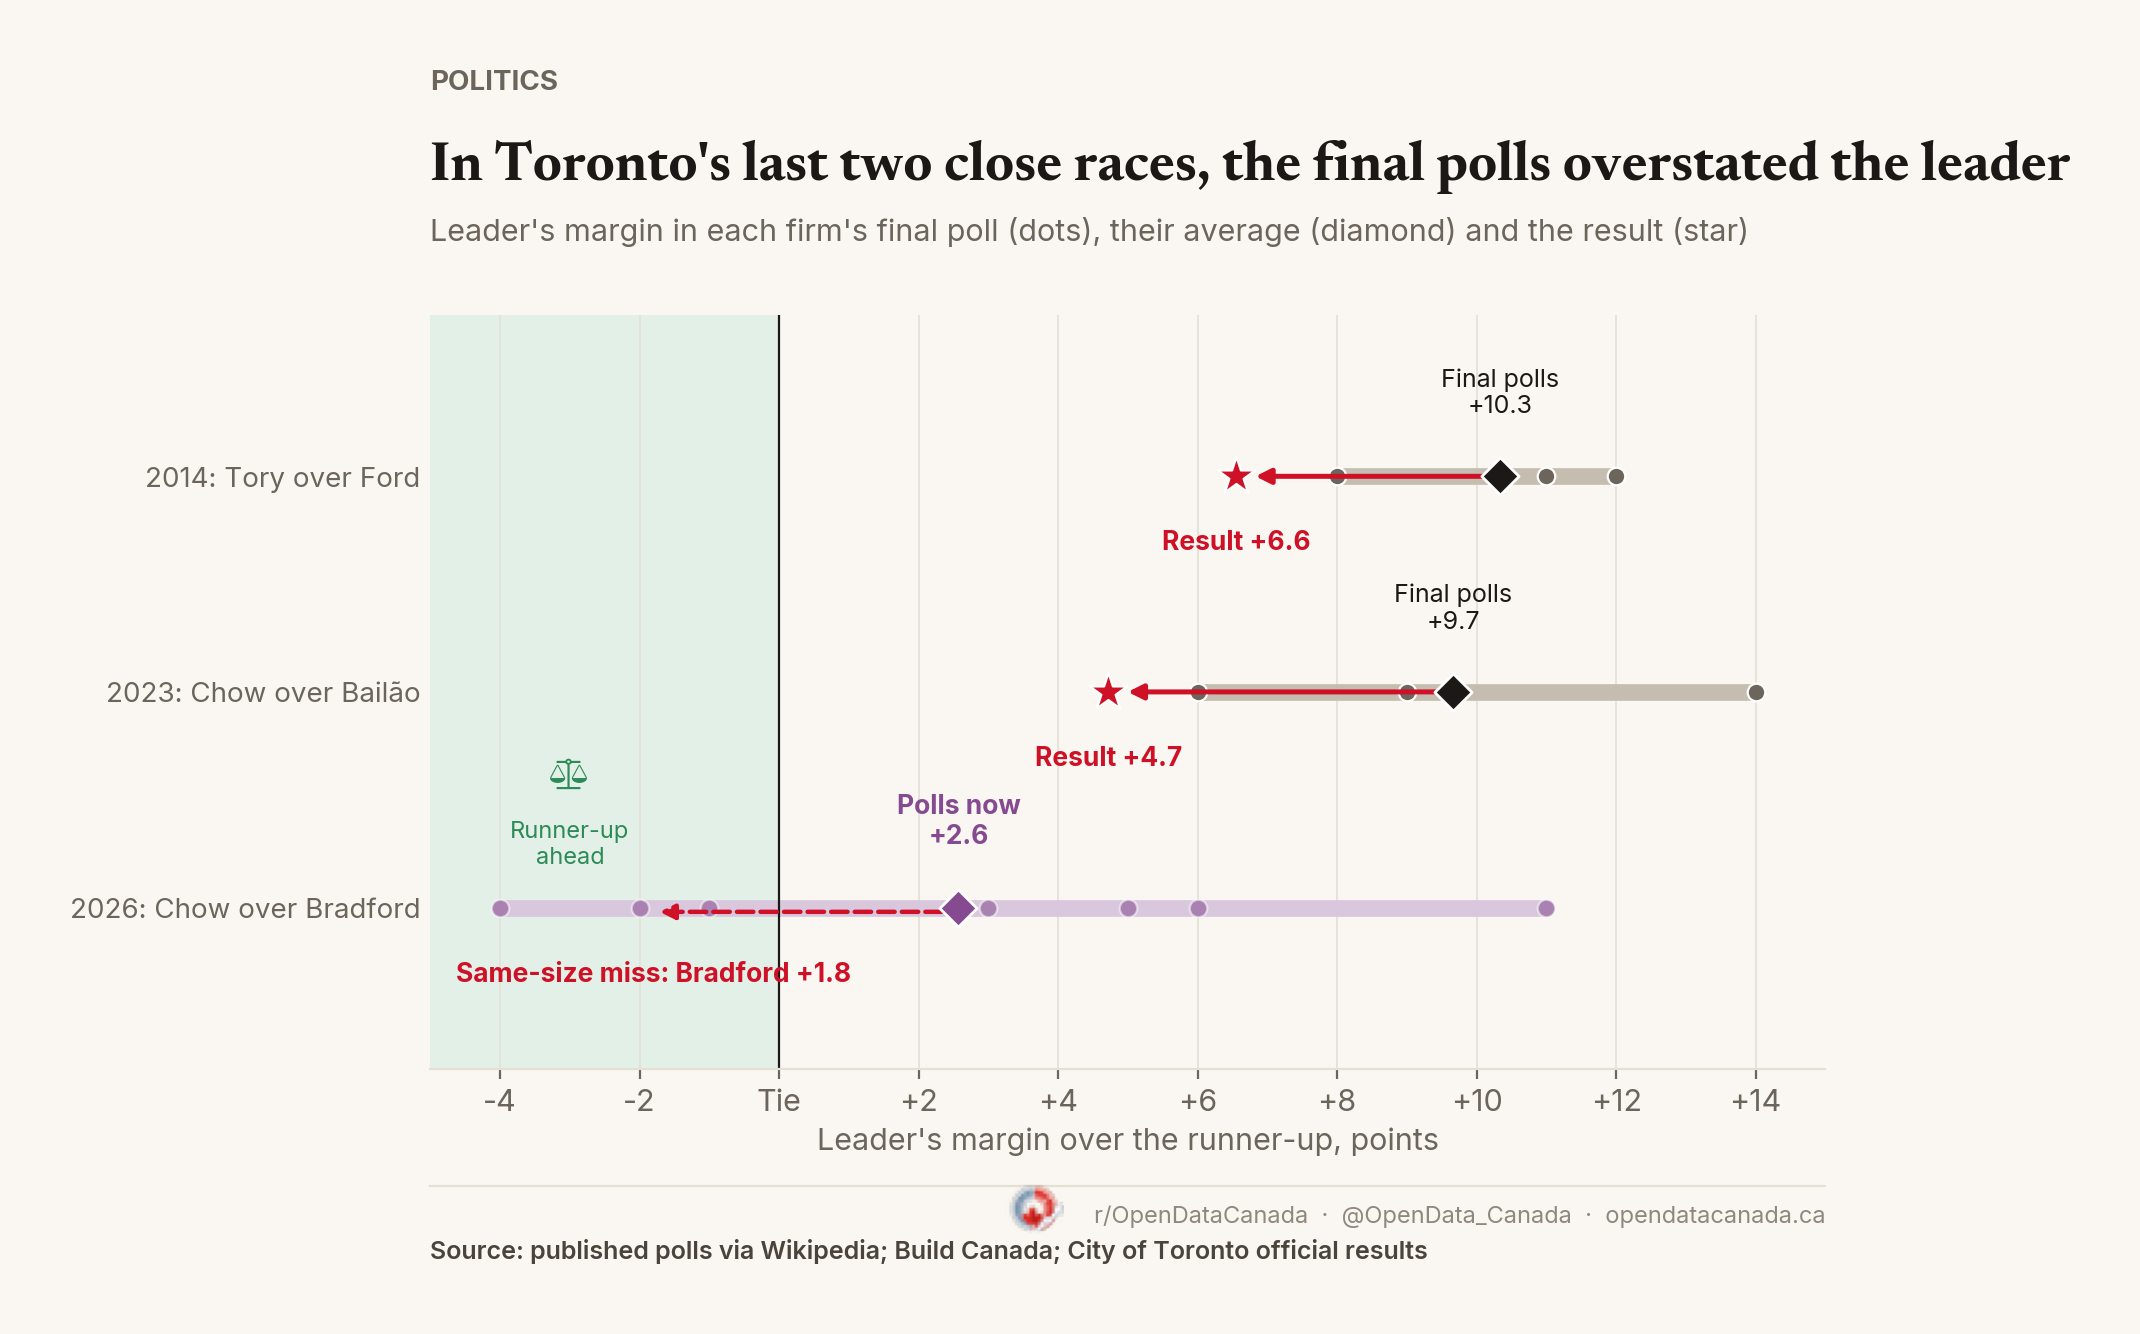
Two elections are a small sample, and each had its own late swing, so this is no forecast that 2026 will miss the same way. But a 4.4-point error on a 2.6-point lead would be enough to change the winner, in either direction.
What are the betting odds for Toronto mayor?
Betting markets are more confident than that. On Polymarket, where about 640,000 US dollars have been traded on the race, a Chow win was priced at about 64 cents on the dollar on Oct. 23. On Kalshi it traded at 65. On Polymarket, Chow traded between 77 and 90 cents from April to early October. Elsewhere in Ontario, several sitting mayors trail a challenger on Polymarket.
Where did Chow win in 2023?
The 2023 by-election map shows where each side starts. Chow won 14 of 25 wards. Her base was the old city: she took about half the vote in Toronto Centre, Toronto-Danforth, Parkdale-High Park, Davenport and Spadina-Fort York. She also won Scarborough North with 47 per cent.
Bailão won Etobicoke, North York's middle wards and most of the inner suburbs. Chow's weakest wards were Etobicoke Centre (21 per cent), Eglinton-Lawrence (24) and York Centre (24).
This year's polls show a similar split. Liaison's Oct. 18 to 19 poll has Chow ahead downtown, 55 to 41, and Bradford ahead in North York, 56 to 42, and Etobicoke, 63 to 35. Scarborough is split 49 to 48. Regional samples are small, but the shape matches 2023.
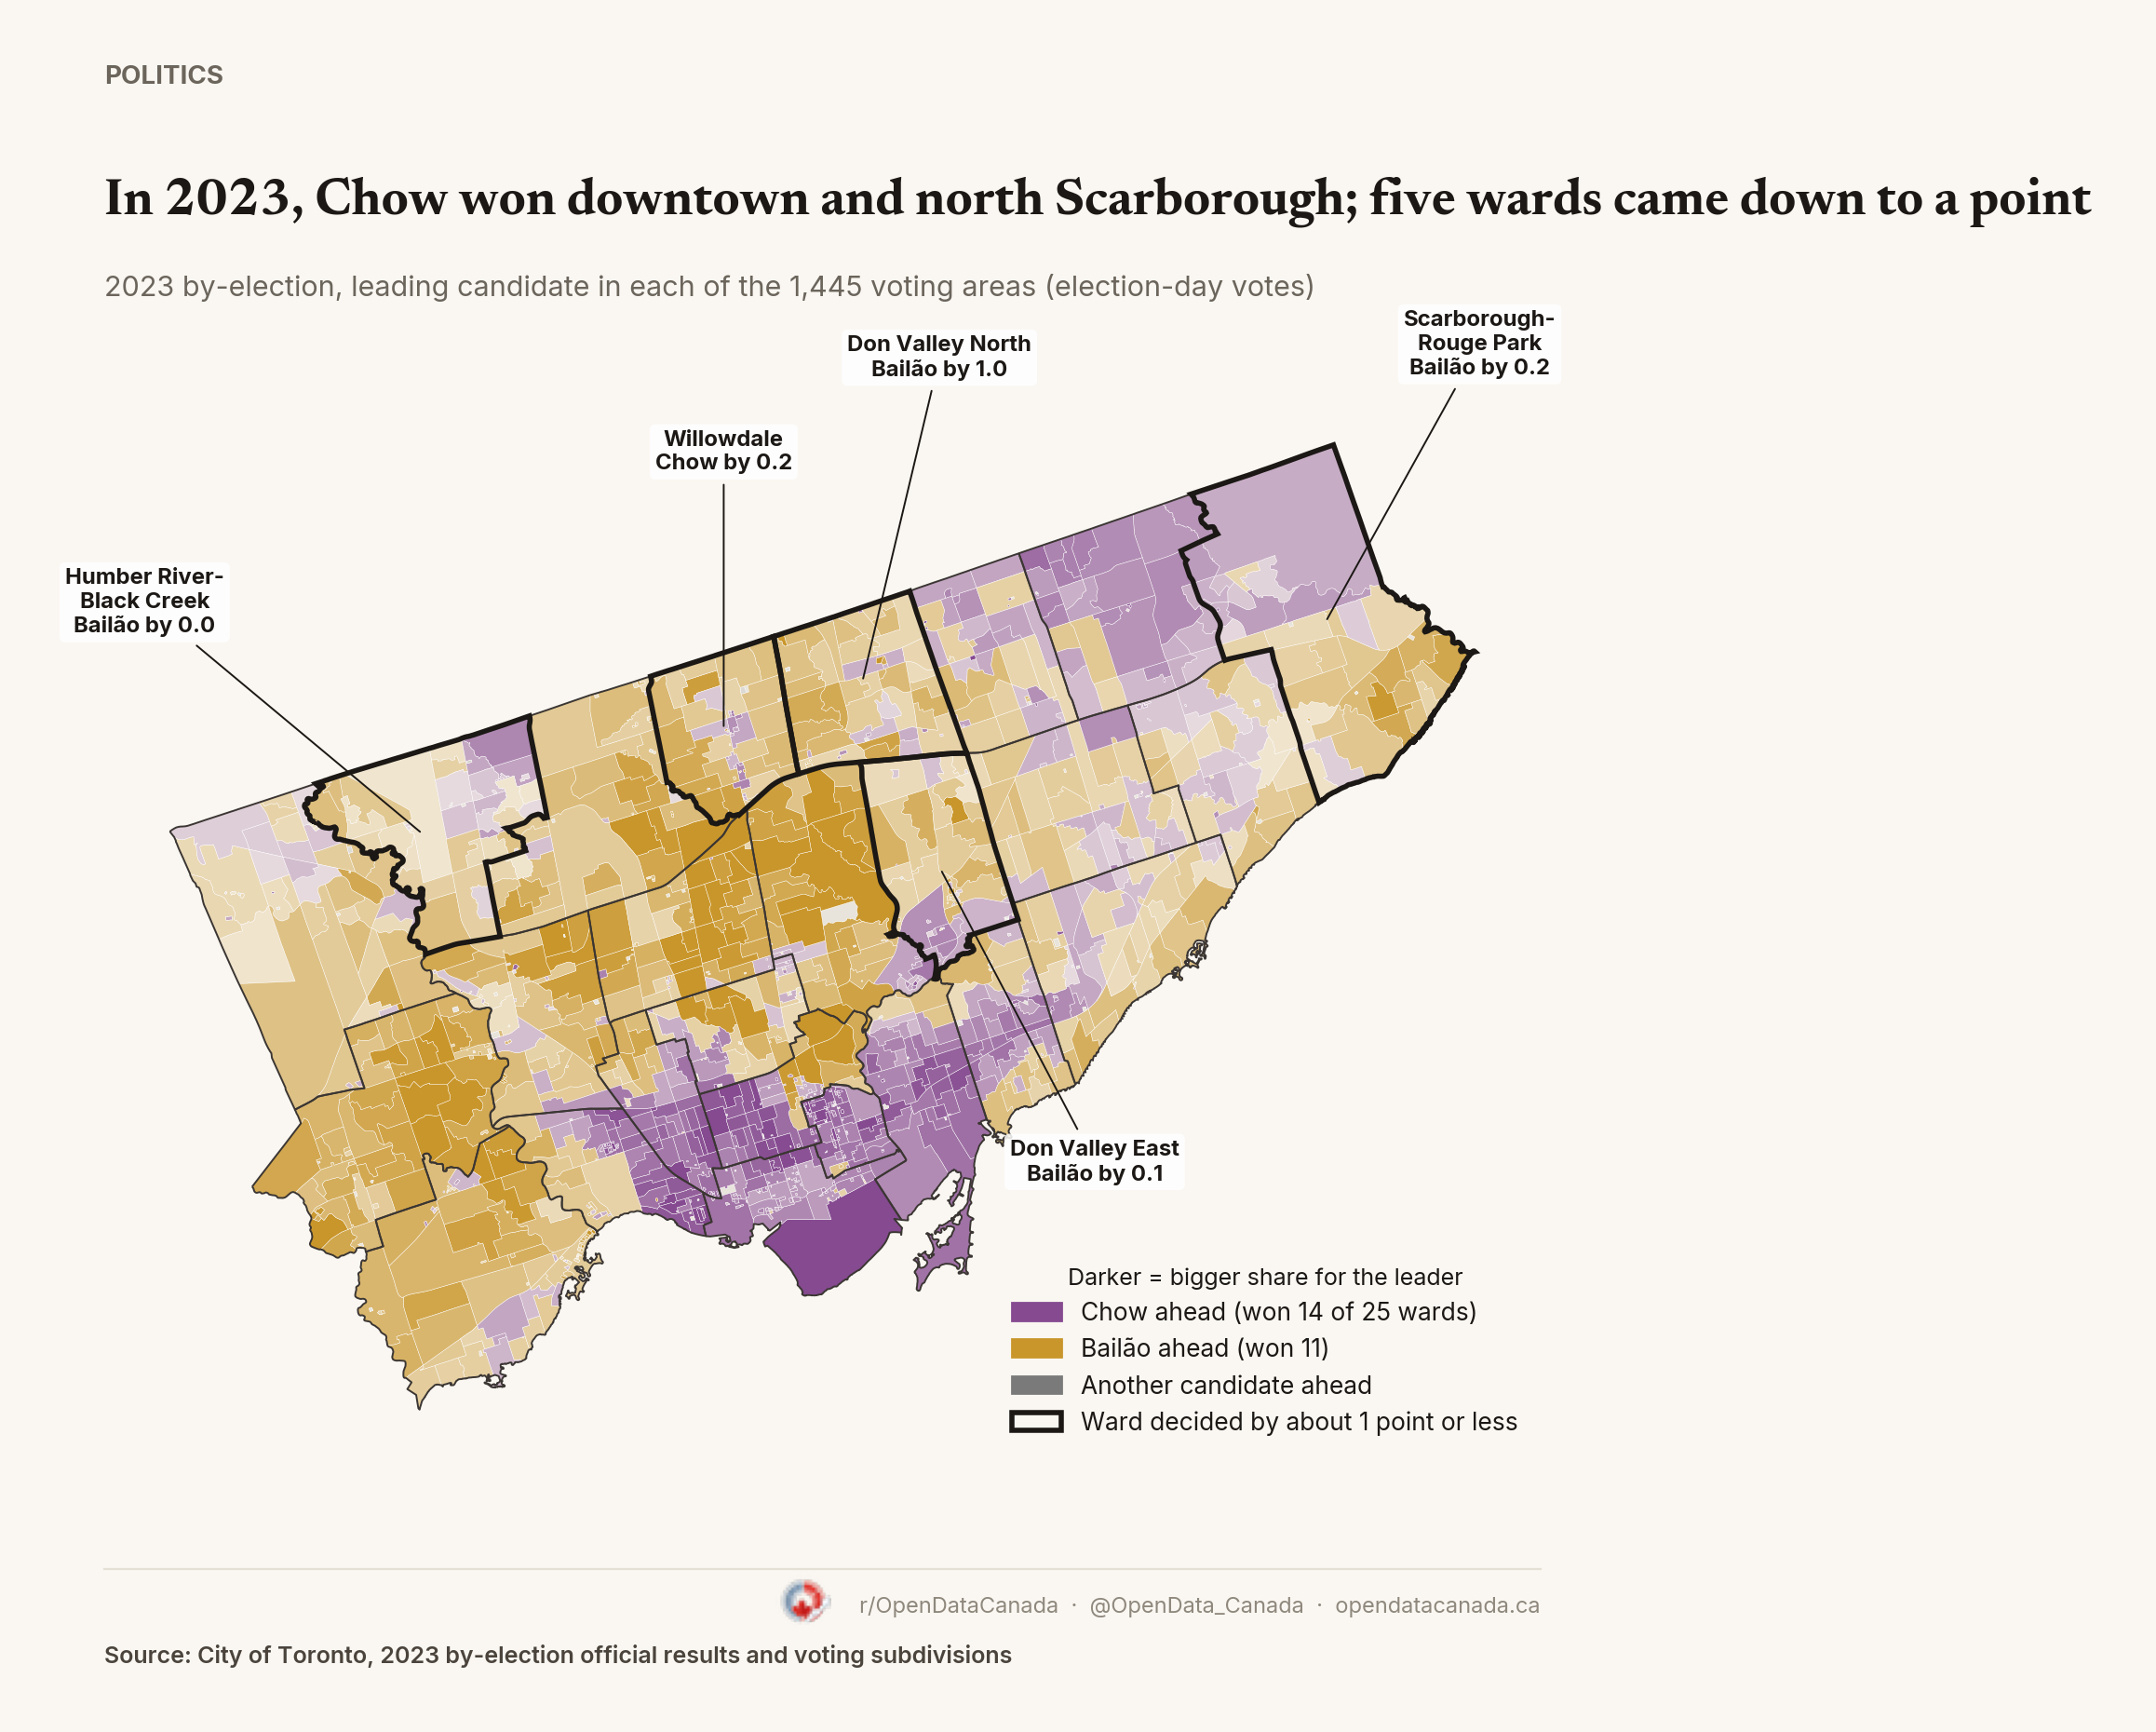
Five wards were decided by about a point or less, all of them in the inner suburbs. Humber River-Black Creek came down to 2 votes out of 15,936:
| Ward | Chow 2023 | Bailão 2023 | Margin |
|---|---|---|---|
| Humber River-Black Creek | 28.1 | 28.2 | Bailão by 2 votes |
| Don Valley East | 33.5 | 33.6 | Bailão by 0.1 |
| Scarborough-Rouge Park | 32.4 | 32.5 | Bailão by 0.2 |
| Willowdale | 34.9 | 34.7 | Chow by 0.2 |
| Don Valley North | 33.8 | 34.8 | Bailão by 1.0 |
Those wards, plus the inner-suburban wards Bailão won comfortably, are where Bradford needs to beat Bailão's 2023 numbers. Chow, meanwhile, needs to hold her downtown share and keep turnout up in it.
Can Bradford win his own ward?
Bradford ran for mayor in 2023 and finished eighth citywide with 1.3 per cent. In his own ward, Beaches-East York, he got 4.7 per cent. Chow took 43.1 per cent there. This year he is the only serious alternative to Chow, rather than one of 102 candidates.
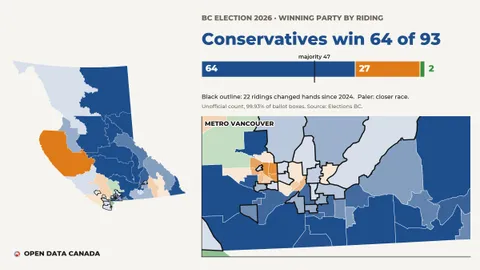
For other votes this month, see the BC election polls and riding map and how many mayors and councillors each province has per person.
When will Toronto's results be known?
Polls close at 8 p.m. on Monday. The City publishes unofficial results on election night, ward by ward. With more than 220,000 advance votes already cast and the polls this close, an early call may be hard.
Chow leads in four of seven final polls, by an average smaller than the error Toronto's final polls made in the last two close races. The polls can't call this one.
Outside Toronto, 9 of 20 big-city mayors lost: see every Ontario mayor result.