
Politics · Polls · Chart
Federal vote intention by age since the 2025 election
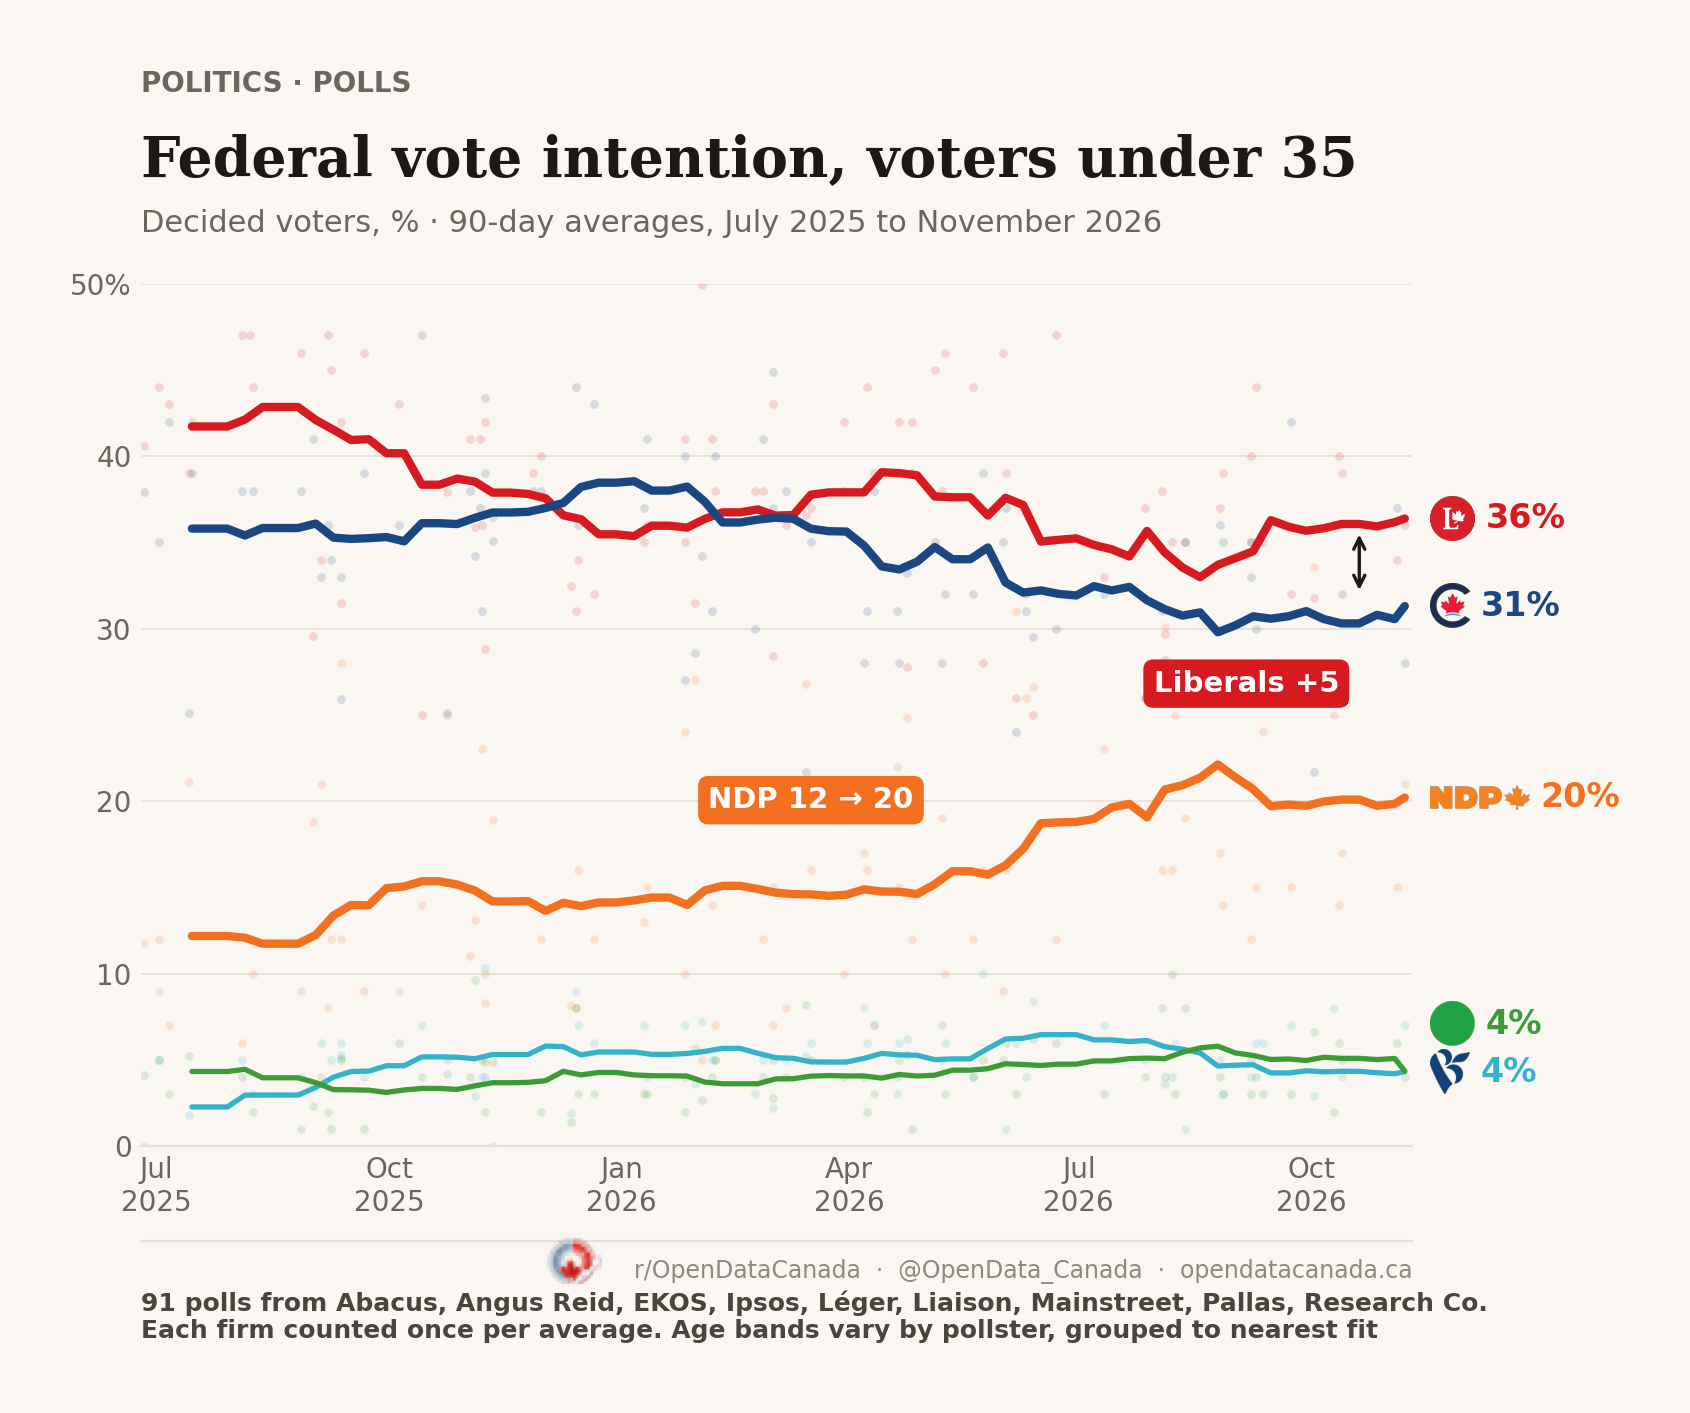
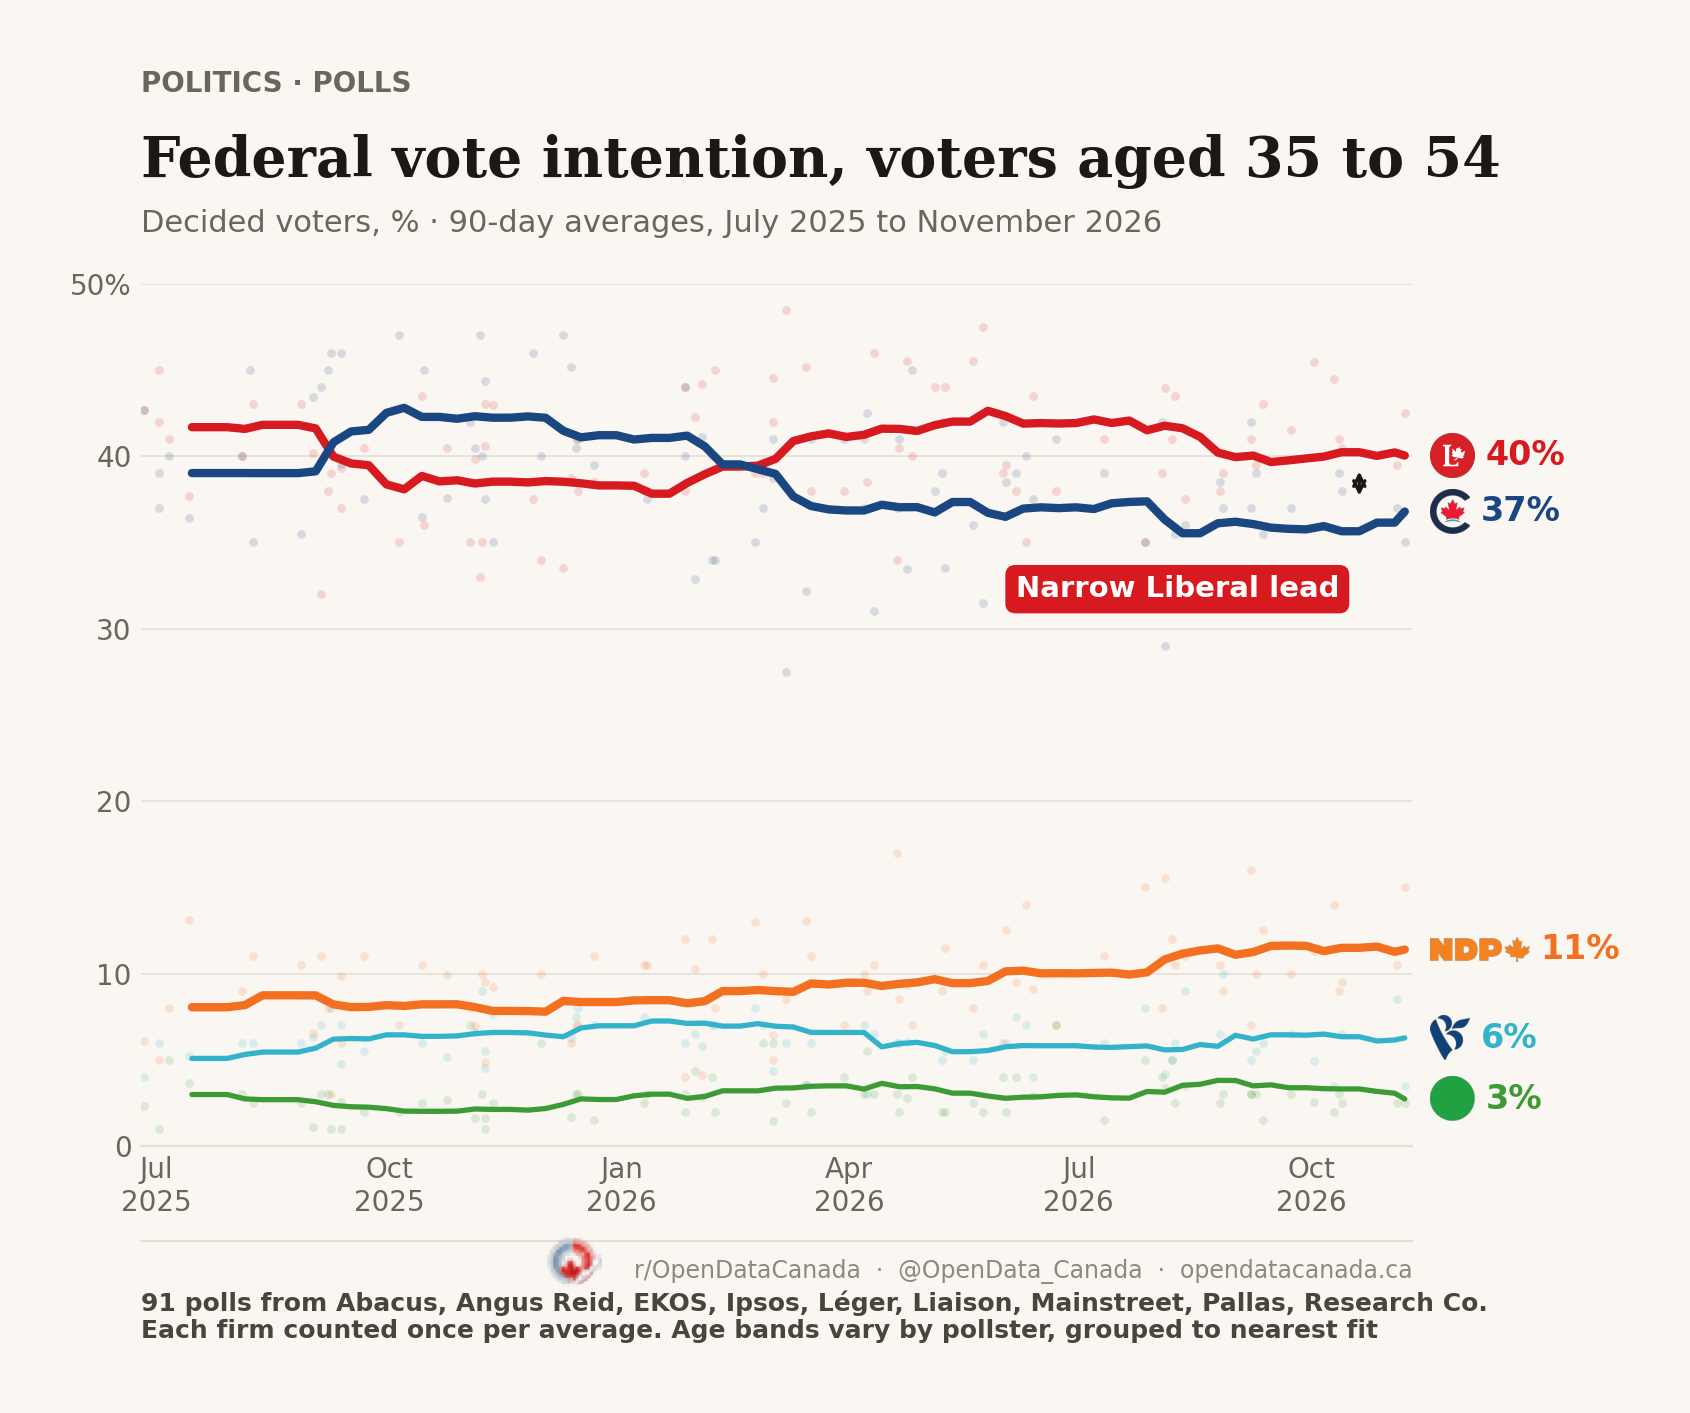
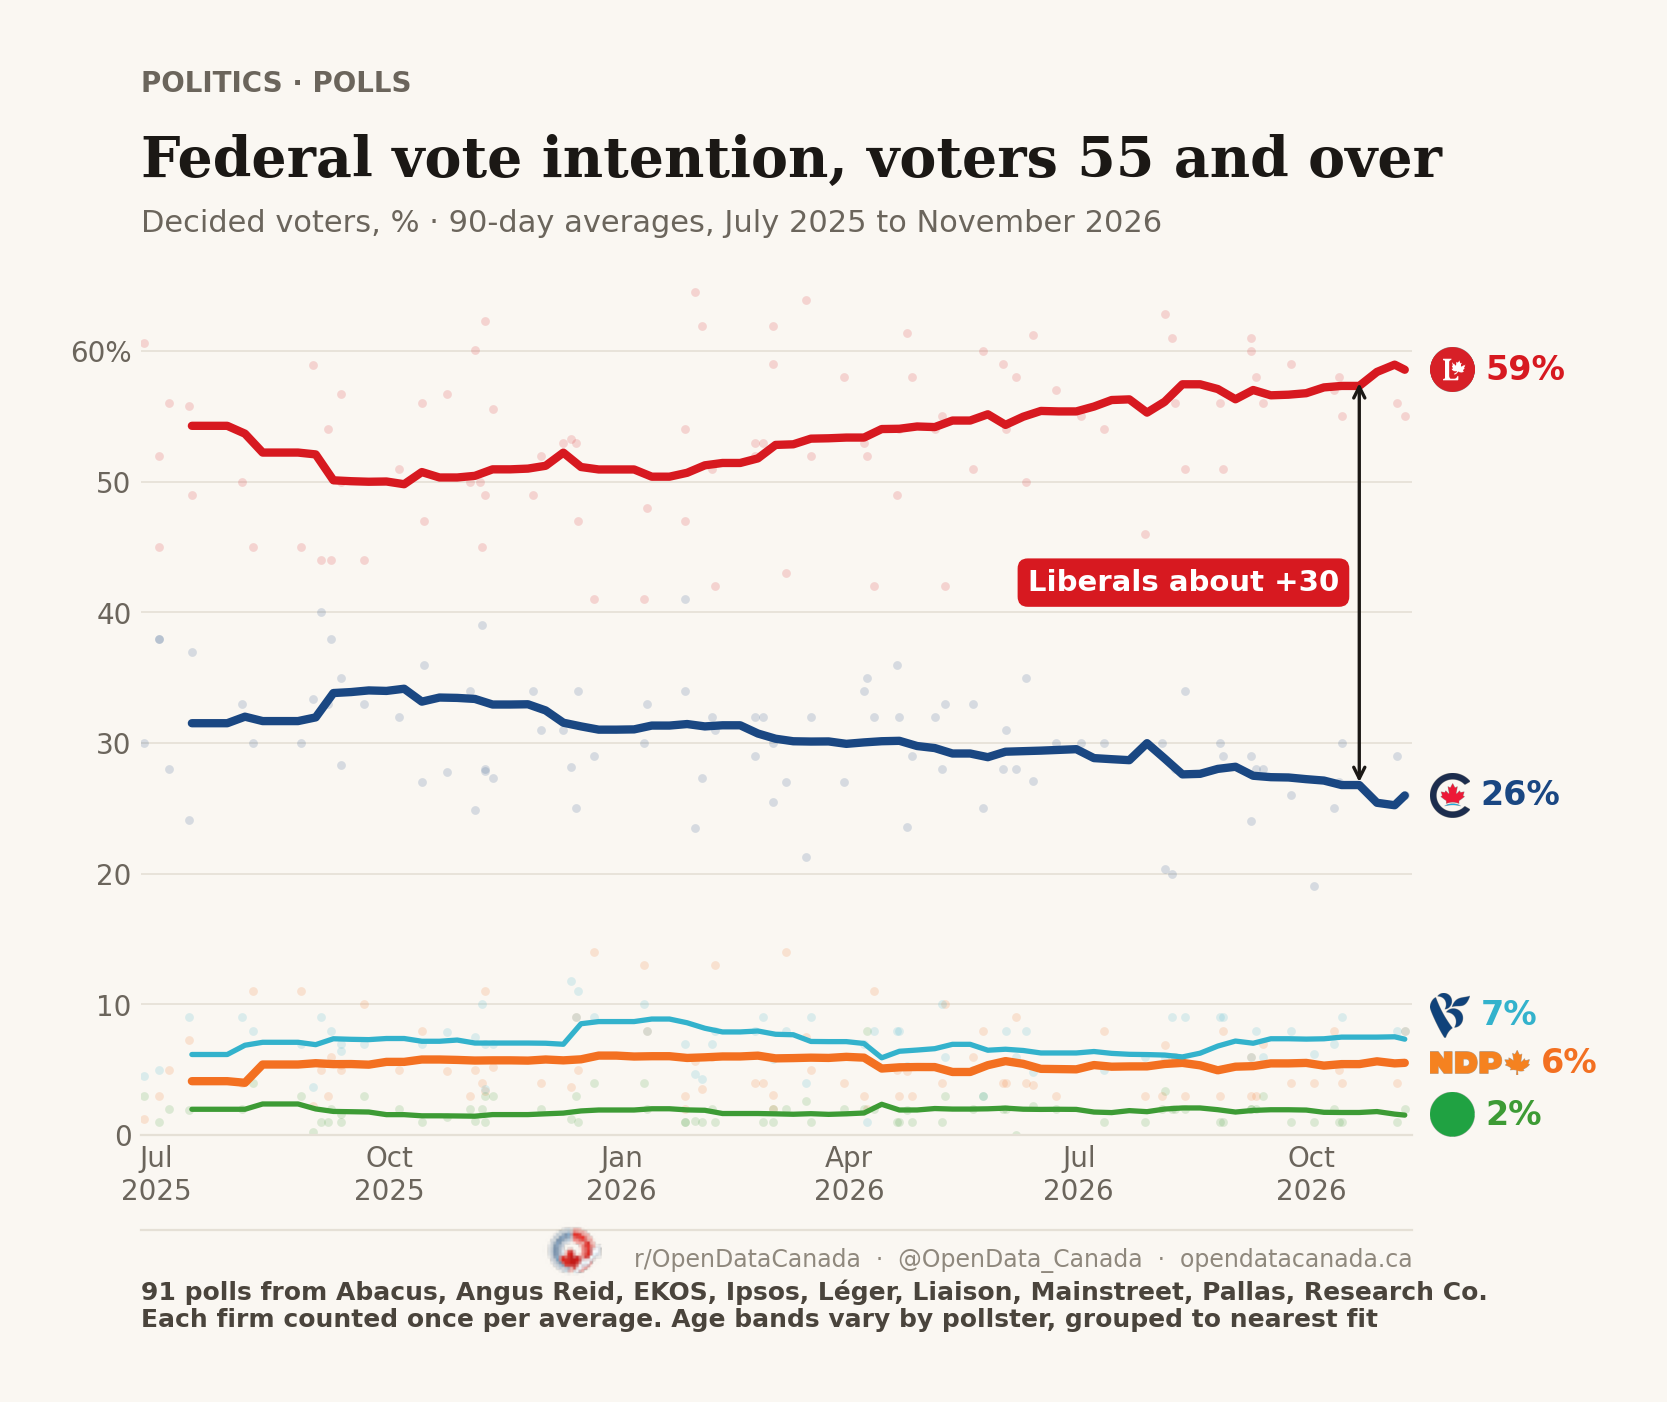
The Liberals lead in all three age groups, but by very different margins: 5 points among voters under 35, a narrow 1 to 4 points among those aged 35 to 54, and about 30 points among those 55 and over. Among the youngest voters, the NDP has risen from 12% to 20%, mostly since June 2026.
What the charts show
Each line is a 90-day average of published polls, from July 2025 to 7 November 2026. Dots are single polls.
- Under 35: the Liberals fell from 42% to 36% and the Conservatives from 36% to 31%. The NDP gained the most, from 12% to 20%, with most of the rise in June 2026. The Conservatives briefly led this group from December 2025 to early February 2026, by up to 3 points.
- 35 to 54: the closest group. The Conservatives led through late 2025 and into early 2026. The Liberals now have a narrow lead of about 1 to 4 points, depending on which pollsters are included.
- 55 and over: the widest gap. The Liberals rose from 54% to 59% and the Conservatives fell from 32% to 26%. The lead is about 30 points; the latest average reads 33, lifted by an older poll leaving the 90-day window.
For the overall numbers, see the federal polling average.
Common questions
Which age group is most Liberal? Voters 55 and over, at 59% Liberal and 26% Conservative.
Are young voters moving to the Conservatives? Not in these polls. The Conservatives briefly led this group last winter, but have since fallen to 31%, down from 36% in July 2025; the NDP gained instead.
Why are the numbers different from other poll trackers? Pollsters split ages differently, for example 18 to 29 or 18 to 34. We grouped each pollster's bands into the closest of three groups, so treat the levels as approximate. The trends are steadier than any single number.