Article · Public health · 6 min read
BC's opioid deaths are falling everywhere but one Vancouver neighbourhood
British Columbia recorded 1,826 illicit-drug toxicity deaths in 2025, down 21% from the year before — the second straight annual decline. But the drop is uneven. One Vancouver neighbourhood, the Downtown Eastside, still loses residents at roughly ten times the provincial rate.
We wrote in April that Canada's national opioid death rate passed the United States in 2024 — and that the entire gap came from British Columbia. This is the sequel, one level down. Inside BC, the same pattern repeats: a province-wide number that is falling, wrapped around a handful of communities where it barely moves.
The province is improving
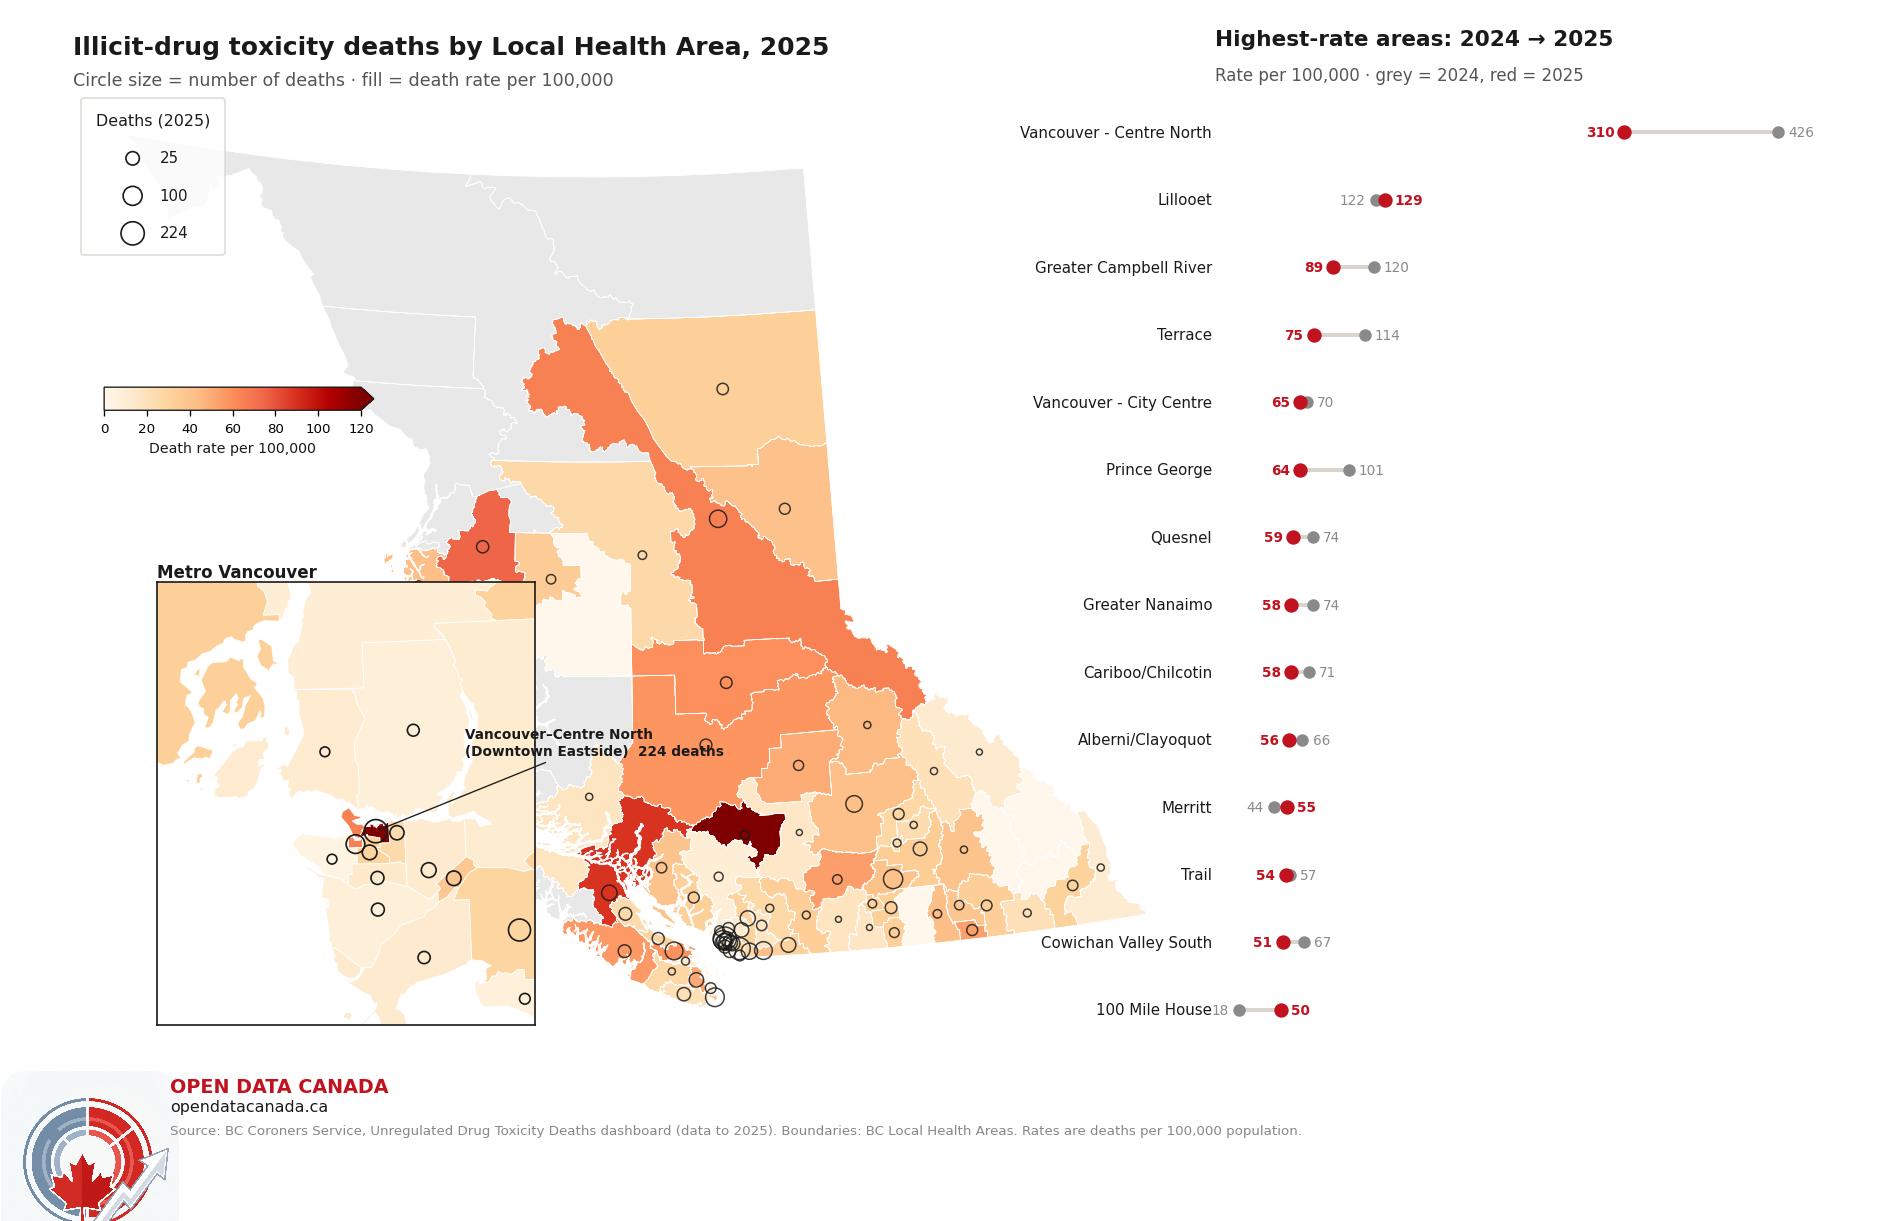
The headline is genuinely good news. BC's illicit-drug deaths peaked at 2,590 in 2023, fell to 2,315 in 2024, and dropped again to 1,826 in 2025 — a 21% year-over-year decline that returns the province to roughly its 2020 level of 1,775. The map's ranking panel makes the trend visible: for almost every high-rate community, the 2025 dot (red) sits to the left of its 2024 dot (grey). Rates are coming down nearly everywhere at once, which points to something province-wide — a shift in the drug supply, the scale-up of naloxone and drug-checking, or both — rather than a local success story in any one place.
The concentration is the story
A plain shaded map of BC would hide the crisis, because the places hit hardest are geographically tiny. Vancouver–Centre North — the Downtown Eastside — is a few square kilometres, invisible next to the vast northern Local Health Areas. So the map sizes each circle by the number of deaths and shades it by the rate, with a Metro Vancouver inset to make the urban core legible.
What it shows is extreme concentration. The six Local Health Areas that make up the City of Vancouver recorded 414 deaths in 2025 — nearly 23% of the provincial total in a city with about 14% of BC's population. Add Surrey (179), Kelowna's Central Okanagan (104), Greater Victoria (94) and Abbotsford (76), and the top six areas alone account for more than 40% of every illicit-drug death in the province.
| Local Health Area | 2025 deaths | 2025 rate /100k |
|---|---|---|
| Vancouver – Centre North (DTES) | 224 | 310 |
| Surrey | 179 | 29 |
| Central Okanagan (Kelowna) | 104 | 42 |
| Greater Victoria | 94 | 37 |
| Vancouver – City Centre | 94 | 65 |
| Abbotsford | 76 | 43 |
| Greater Nanaimo | 76 | 58 |
Surrey is the clearest illustration of why count and rate diverge: it records the second-most deaths in the province but, spread across a large population, one of the lower rates on this list — below several small interior towns.
Rate vs. count tell different stories
The communities with the highest rates aren't all big cities. Lillooet (129 per 100,000), Greater Campbell River (89), Terrace (75) and Quesnel (59) are small interior and northern towns where a relatively small number of deaths lands on a small population. These are the places a count-based map misses entirely and a rate-based map over-dramatises — which is why the better read comes from holding both encodings, size and colour, in the same frame.
For someone searching "is there a fentanyl crisis in Vancouver" or "opioid deaths in Kelowna," the honest answer the data gives is: yes, and it is concentrated, and it is — for now — declining. The Downtown Eastside remains the epicentre by a wide margin, but the 2025 numbers are the lowest in five years across most of the province.
What to watch
Nearly a decade into this crisis — BC declared a public-health emergency in 2016 — the open question is whether 2025's decline holds. BC's drug-checking services reported fentanyl concentrations stabilising in some markets after years of escalation; harm-reduction infrastructure has scaled; and the most vulnerable long-term users have, brutally, already died, shrinking the at-risk population. None of those explanations excludes the others. The 2026 data — and whether the Downtown Eastside rate keeps falling from 426 to 310 to something lower still — will be the real test.
Read next
Corrections: Methodology errors or missing caveats — message r/OpenDataCanada.