Article · Justice · 7 min read
More cops, less crime? Not in Canadian cities.
Calgary spends roughly a third less per resident on policing than Montréal, and has less violent crime to show for it. Across 29 major Canadian metropolitan areas, the correlation between officers per 100,000 residents and the violent Crime Severity Index is essentially zero. Built from the 2025 Police Administration Survey, released Wednesday.
Statistics Canada published the 2025 Police Administration Survey on Wednesday — the first full update to officer counts and policing expenditures in two years. Pair it with the 2024 Crime Severity Index and you can finally test something Canadians argue about every election cycle: does paying for more police actually buy a safer city?
For the country's biggest urban areas, the answer is barely.
The scatter plot
The chart below plots every major Canadian metropolitan area on two axes: how many police officers it employs per 100,000 residents, and how violent it is by the Crime Severity Index. If the "more cops equals less crime" instinct held, the dots would fall along a clean downward line.
They don't.
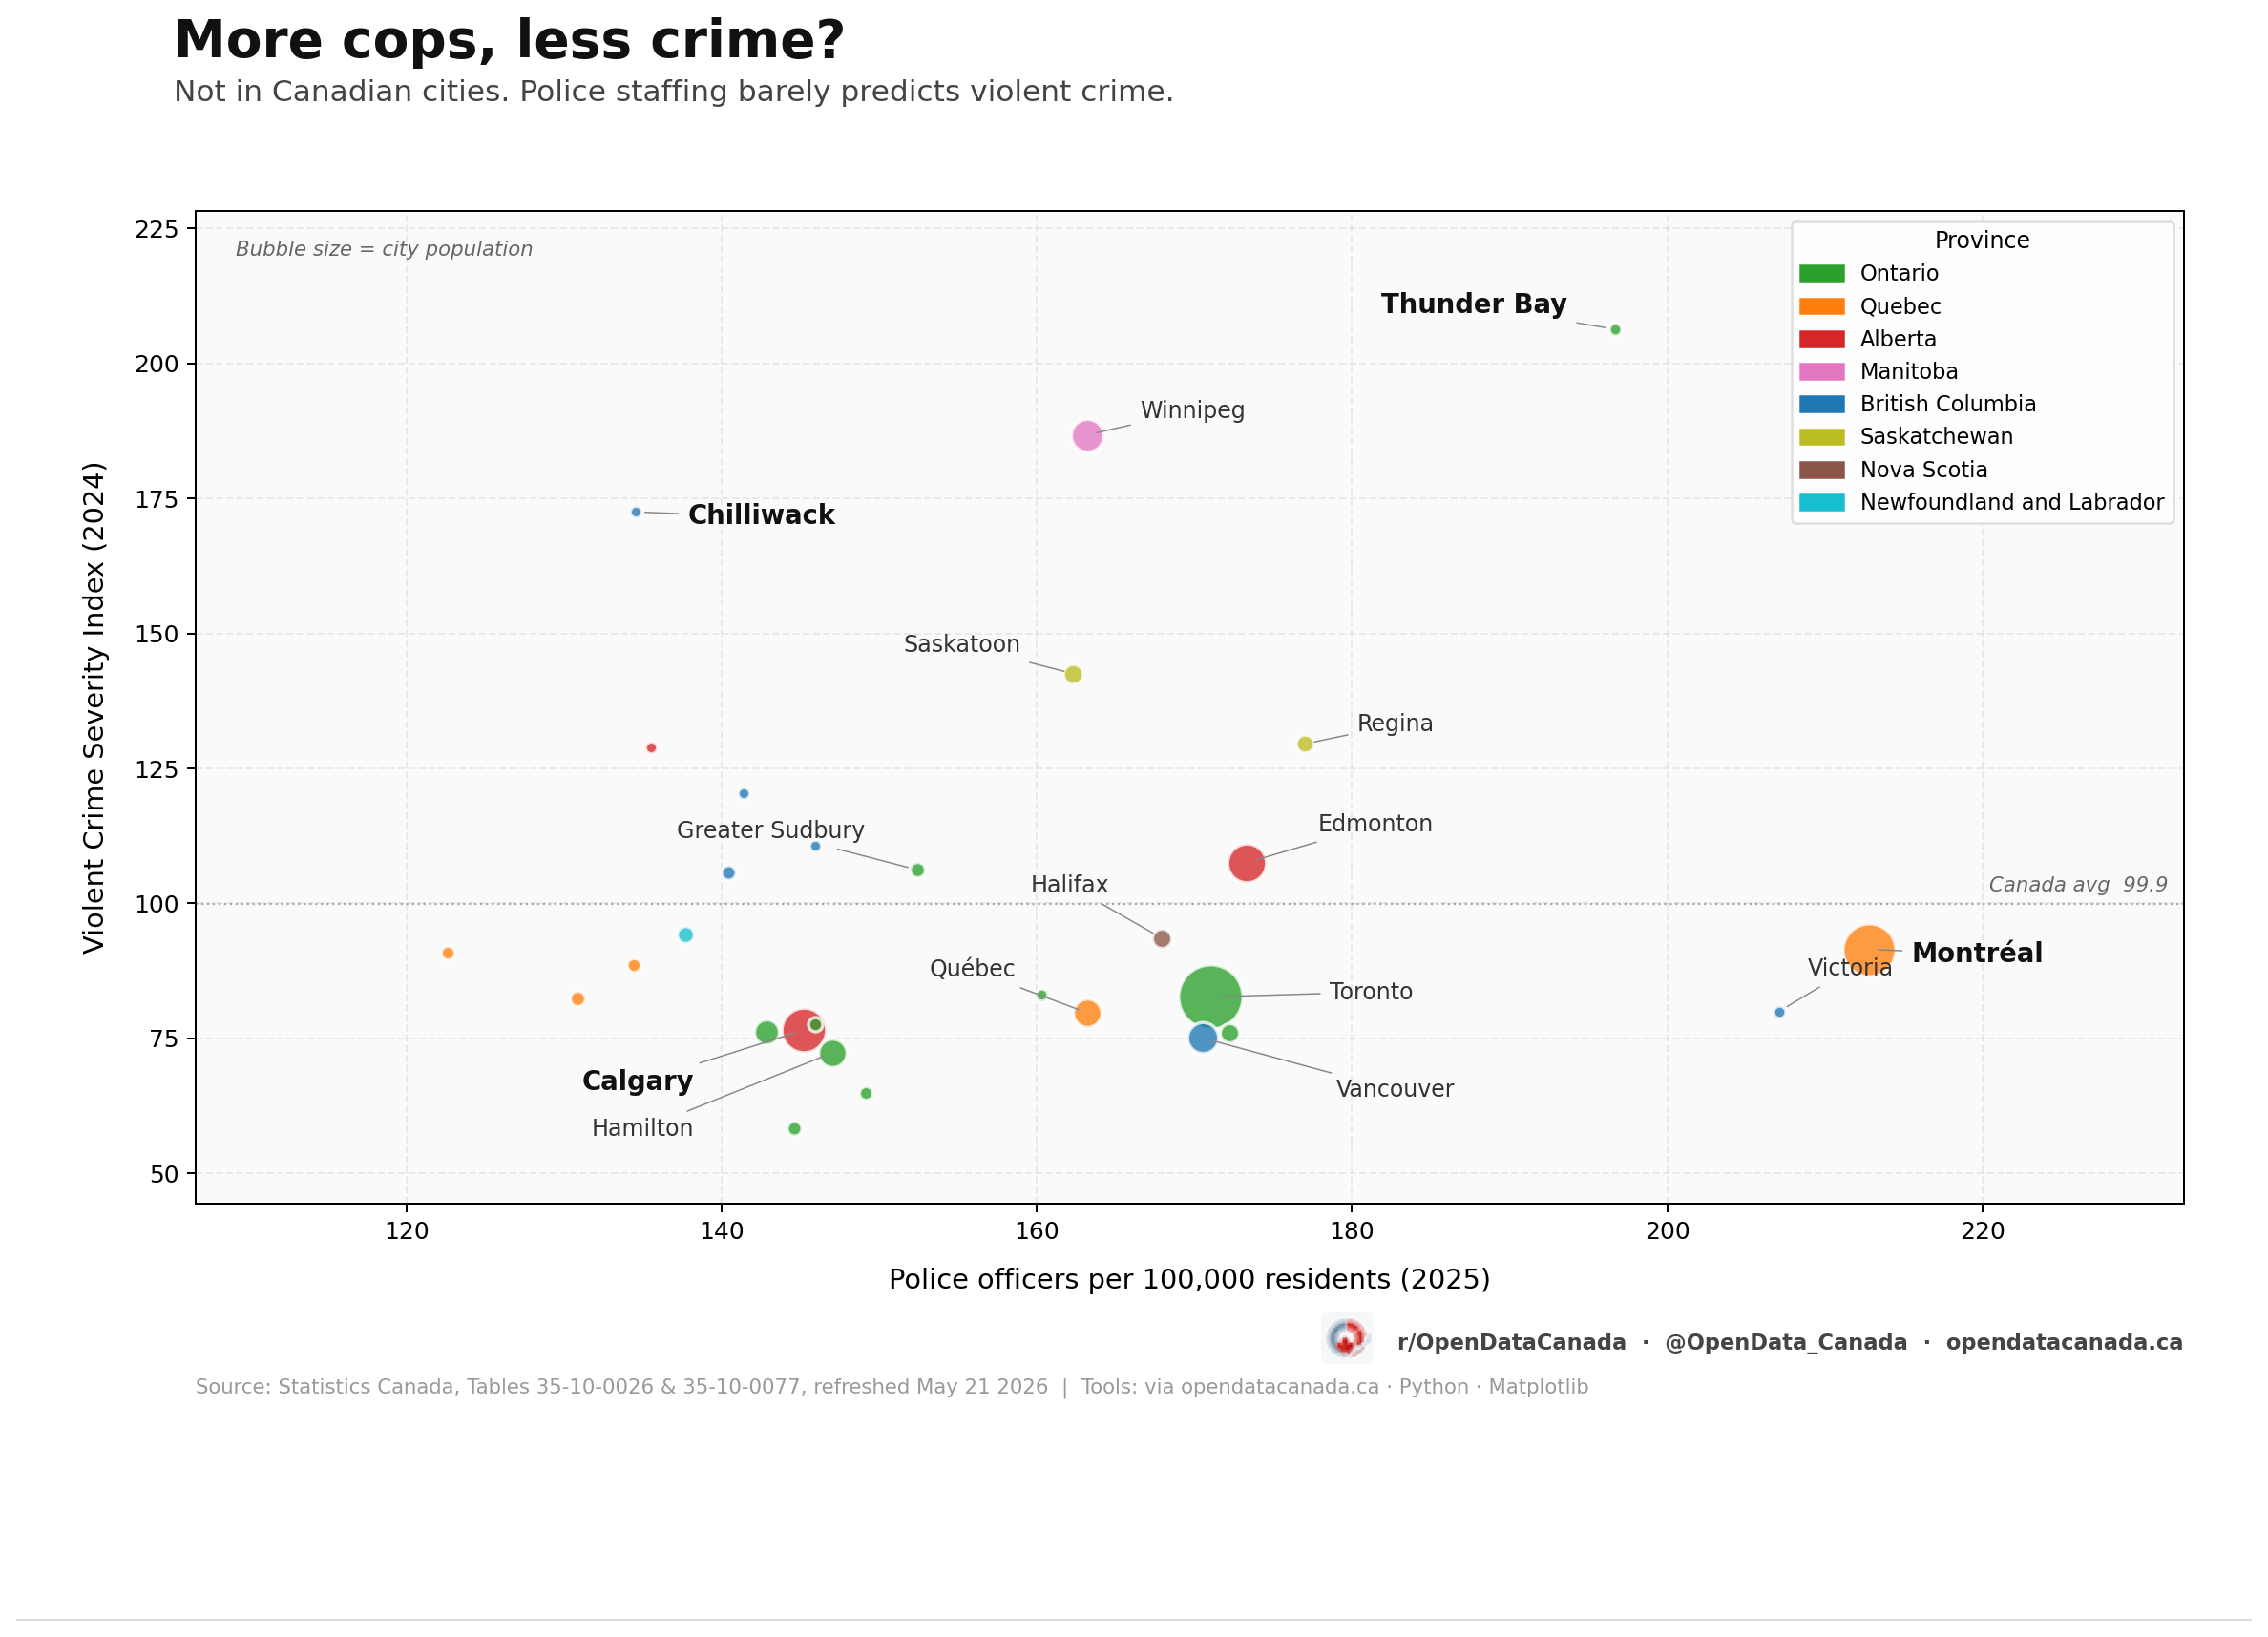
The 29 CMAs scatter across all four quadrants. Some high-spend cities are very safe (Montréal, Victoria). Some high-spend cities are very unsafe (Thunder Bay, Regina, Edmonton). Some low-spend cities are safe (Hamilton, Calgary). And some low-spend cities are deeply unsafe (Chilliwack). The Pearson correlation between officers per 100,000 and violent CSI is just zero point one five. Drop Thunder Bay and it flips to roughly negative zero point zero six — noise.
Four cities tell the whole story
Calgary runs the leanest big-city force in the country: one hundred forty-five officers per one hundred thousand residents. That is roughly thirty-two percent fewer than Montréal (213 per 100,000), sixteen percent fewer than Toronto (171), and sixteen percent fewer than its provincial neighbour Edmonton (173). Yet Calgary's violent CSI is seventy-six point five — below Toronto, below Vancouver, and dramatically below Edmonton (one hundred seven). Whatever combination of geography, demographics, and economic conditions produces that gap, more cops on the road is not the active ingredient.
Montréal sits at the other end of the same trade: the highest officers-per-capita of any large Canadian city at two hundred thirteen per one hundred thousand, and a violent CSI of ninety-one point five — slightly above Toronto and Calgary, dramatically below the prairie cities. Quebec, by far the country's most police-heavy province, spends more per resident on policing than anywhere else. From the data, it does not obviously get a clearly safer society for the money. Trois-Rivières, with only one hundred twenty-three officers per one hundred thousand, posts a violent CSI of ninety point nine — essentially identical to Montréal.
Thunder Bay has the worst of both worlds: one hundred ninety-seven officers per one hundred thousand and the highest violent CSI in the country at two hundred six. The size of the policing footprint reflects the size of the social problem, not its solution. Same pattern in Winnipeg (one hundred sixty-three per one hundred thousand, CSI one hundred eighty-seven), Saskatoon (one hundred sixty-two, CSI one hundred forty-three), and Regina (one hundred seventy-seven, CSI one hundred thirty).
Chilliwack, an hour east of Vancouver, runs the inverse pattern: just one hundred thirty-five officers per one hundred thousand, a violent CSI of one hundred seventy-three (top five in the country), and a weighted clearance rate of nineteen point five percent — the worst of any Canadian CMA. Police find no resolution to four out of every five reported violations. Whatever the right policy answer is in the BC interior, more staffing of the current model is one of the few experiments that has not been tried at scale.
The four-quadrant pattern
Splitting the cities at the national median (one hundred forty-nine officers per one hundred thousand, violent CSI of ninety-one) puts the same finding in plainer language. The cities are spread roughly evenly across all four quadrants.
The "low-staff, low-crime" nine — Calgary, Hamilton, London, Kingston, Barrie, plus the smaller Quebec metros (Sherbrooke, Trois-Rivières, Saguenay) and Guelph. The cheapest model that works.
The "high-staff, low-crime" six — Toronto, Vancouver, Montréal, Victoria, Québec City, Brantford. Generously policed and decently safe. Whether the spending bought the safety is unprovable.
The "low-staff, high-crime" six — Chilliwack, Red Deer, Kamloops, Kelowna, Nanaimo, St. John's. The BC interior corridor plus a handful of Alberta and Atlantic outliers. Plausibly under-resourced — but Chilliwack's clearance rate suggests staffing alone is not the missing variable.
The "high-staff, high-crime" eight — Thunder Bay, Winnipeg, Saskatoon, Regina, Edmonton, Greater Sudbury, Halifax, Montréal. Big forces, big problems. Staffing here looks like a response to the social challenge, not a solution to it.
What twelve billion dollars buys
The 2025 release puts total Canadian policing expenditure at twelve point three one billion dollars — roughly three hundred sixty-five dollars per Canadian per year. That works out to about one hundred sixty-four thousand dollars per officer when divided across the seventy-five thousand one hundred seven police officers in service. Officer salaries, wages and benefits account for thirteen point seven billion, civilian personnel another three point eight billion, with the rest spread across vehicles, buildings, training, IT, and capital projects.
Applied to each city's officers-per-capita ratio, that yields a rough per-resident policing cost — and the spread is wide. Montréal sits near thirty-five thousand dollars per one hundred residents on policing. Calgary lands closer to twenty-three thousand eight hundred. Hamilton at twenty-four thousand one hundred. The cheapest big-city forces operate at roughly seventy percent of the most expensive ones, and the safety outcome at the cheap end is, if anything, slightly better.
Who actually solves crimes
Separate from the spending question, the weighted clearance rate — the share of reported violations a police service actually resolves — varies wildly across the country.
| Force | Clearance rate |
|---|---|
| Greater Sudbury | 54.6 percent |
| Sherbrooke | 50.2 percent |
| Guelph | 49.8 percent |
| Thunder Bay | 47.6 percent |
| Trois-Rivières | 46.9 percent |
| Calgary | 35.6 percent |
| Toronto | 30.8 percent |
| Vancouver | 23.9 percent |
| Kelowna | 24.4 percent |
| Chilliwack | 19.5 percent |
A resident of Greater Sudbury whose crime is reported gets a two point eight times better shot at resolution than a Chilliwack resident. Whether that reflects crime mix, force capacity, community cooperation, or charging policy is a story for the next data release. The spread itself is real.
The bottom line
The chart does not tilt. Geography, demographics, drug-supply routes, housing markets, and the depth of social investment in a community look like the dominant drivers of inter-city variation in violent crime — not how many officers a city has on payroll.
That is a useful thing for a Canadian voter to keep in mind in a year when "hire more police" is on the ballot in a half-dozen municipal races. The data, this week, says: hire more police if you want — just do not expect the violent-crime number to move because of it.
Method and limits
The Police Administration Survey skipped a 2024 reference year, so the most recent officer counts are 2025 and the most recent violent CSI is 2024. Combining the two is the standard approach used by Statistics Canada in its own 2025 release, but the two series are technically a year apart. Ottawa and Surrey appear as "data not available" in the 2025 release — Ottawa's 2023 numbers suggest a reporting gap, not a force-wide change.
The per-resident policing cost estimate uses the national average per-officer expenditure (one hundred sixty-four thousand dollars) applied to each city's officer-per-100,000 ratio. Provincial salary differences mean these are approximate, not actuarial.
Data joined and queried in BigQuery from the Statistics Canada Web Data Service. Chart built in Python with Matplotlib.
Data sources
- Statistics Canada, Table 35-10-0077-01 — Police personnel and selected crime statistics, municipal police services (2025 reference year, released 21 May 2026)
- Statistics Canada, Table 35-10-0026-01 — Incident-based crime statistics, by detailed violations / Crime Severity Index (2024 reference year)
- Statistics Canada, Table 35-10-0059-01 — Police services expenditures, by detailed expenditures (2025 reference year, released 21 May 2026)
- The Daily — Police resources in Canada, 2025 (Statistics Canada, 21 May 2026)